2 Lab 2—Rock cycle and plate tectonics
Minerals are the building blocks that make up rocks. Rocks are grouped into three categories, determined by the way the rocks were formed: igneous, metamorphic, and sedimentary. Rocks are then identified by the minerals they are made up of and the way in which they were formed.
THE ROCK CYCLE
The formation of these three categories of rocks can be thought of as occurring in a cycle. In this cycle, magma comes up from the mantle of the earth. It either cools inside the crust to form intrusive igneous rocks or exits by volcanoes to cool on the surface, resulting in extrusive igneous rocks. Igneous rocks can be buried deep within the crust, and then through exposure to high temperatures and pressures, they change physically and chemically into metamorphic rocks. Metamorphic rocks can be buried deeper to further alter them into a different type of metamorphic rock. Igneous rocks and metamorphic rocks come to, or close to, Earth’s surface through tectonic uplift. They are then exposed to weathering processes and can be eroded, transported, deposited, and buried to become compacted and cemented into sedimentary rocks. Sedimentary rocks can also then be uplifted and be a source for sediment to make new sedimentary rocks or can be more deeply buried to become metamorphosed into metamorphic rocks. All three rock types—igneous, sedimentary, and metamorphic—can be melted deep inside Earth to become magma again.
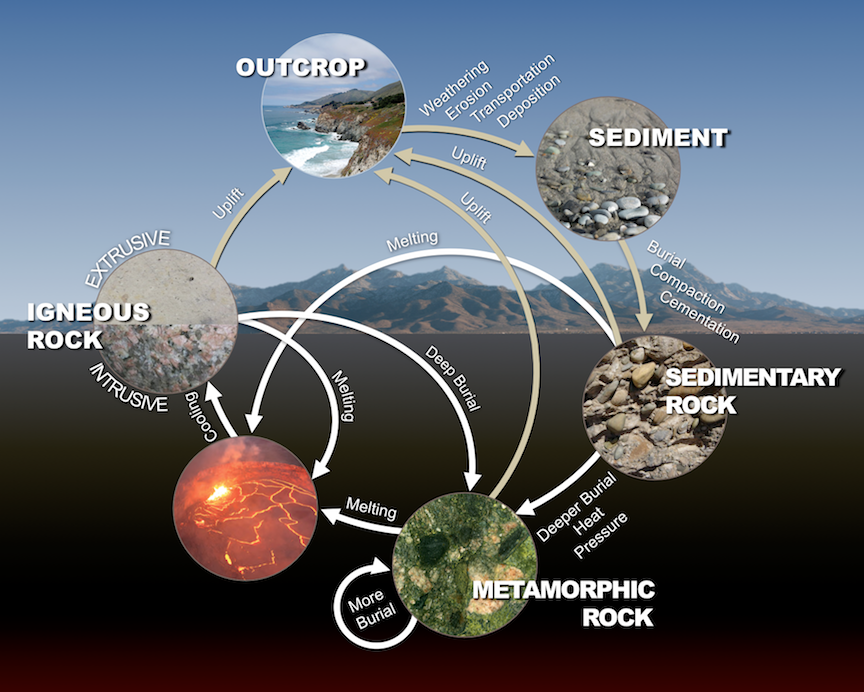
Figure 3.1. The rock cycle illustrates the processes that form the three types of rocks: igneous, sedimentary, and metamorphic. (Panchuk, 2019)
STRUCTURE OF THE EARTH
Our earth can be thought of as spherical, consisting of three major concentric layers from outside to the center: the crust, the mantle, and the core. These layers are further subdivided according to their composition and physical behaviors. The earth’s crust, both the oceanic and continental crust are made up of the rocks described above in the rock cycle. The boundary between the crust and the mantle, also known as the Moho, is defined by a change in the way that earthquake waves propagate through those materials. The uppermost mantle is solid; it moves in tectonic plates with the crust, and the two together—the crust and the uppermost part of the mantle—are called the lithosphere. The lithosphere can be visualized as a collections of plates, kind of like puzzle pieces, that interact in tectonic processes. The lithospheric plates ride on the viscous asthenosphere, or lower mantle. The convection currents in the asthenosphere drive the process of plate tectonics. Below the mantle is Earth’s core, consisting predominantly of iron and nickel: a solid inner core surrounded by a liquid outer core. It is believed that the convection of the liquid metal outer core induces the earth’s magnetic field.
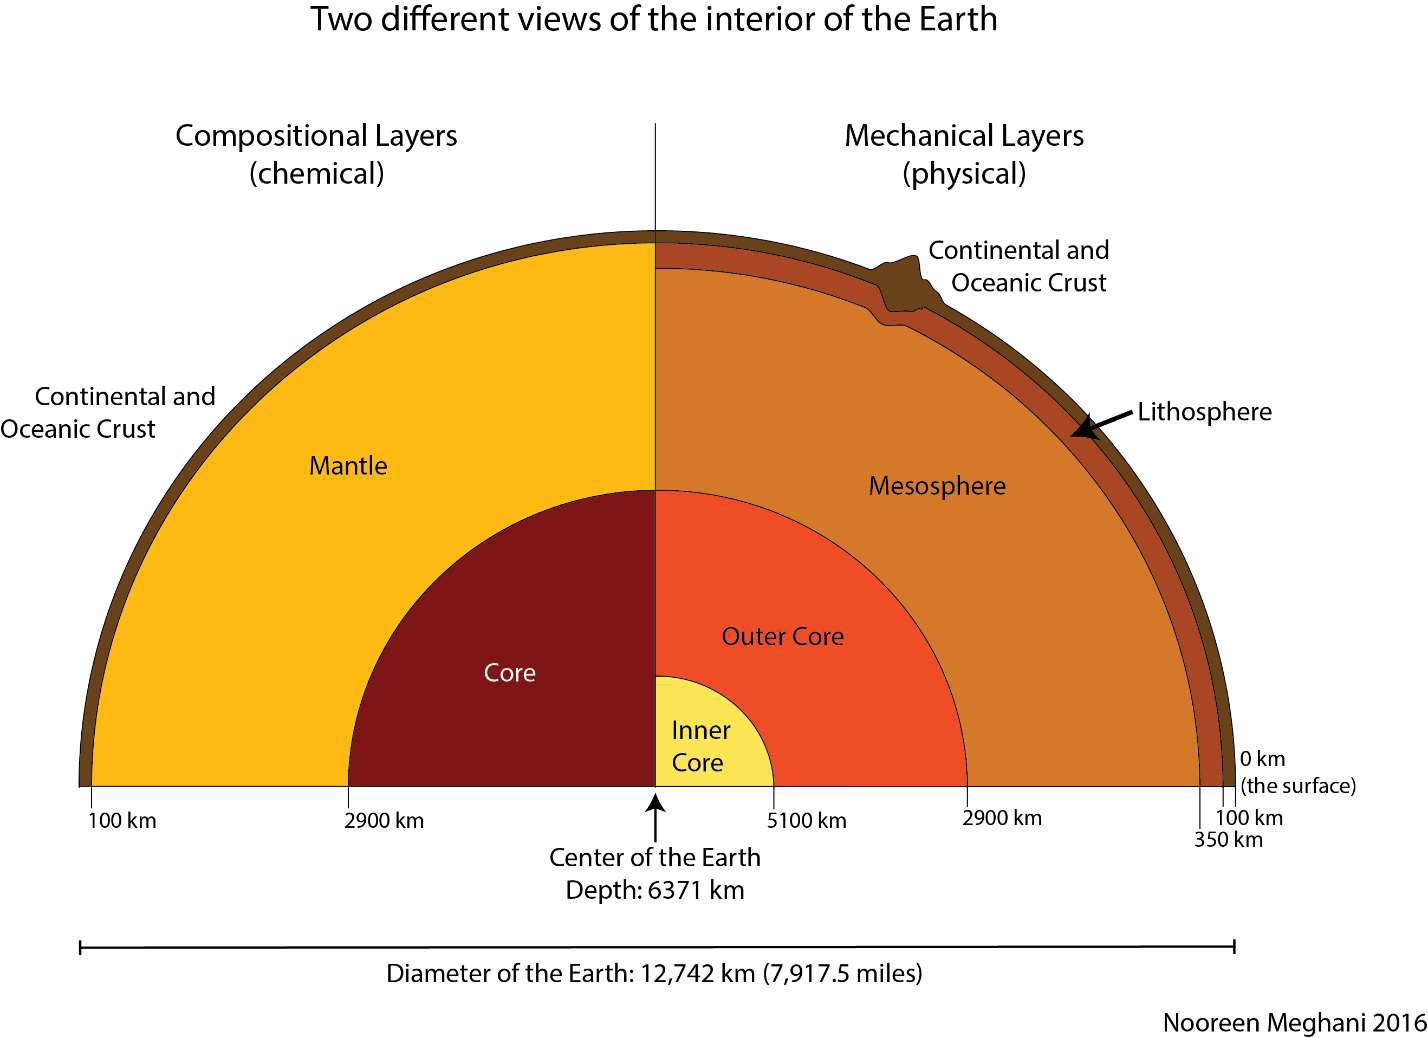
Figure 3.2. Earth’s layers: divided by composition on the left and by physical properties on the right (Meghani, 2016).
PLATE TECTONICS
Alfred Wegener is widely recognized as the first person to put forth, in 1929, the concept of continental drift that would serve as the basis for the theory of plate tectonics. He wrote: “The forces which displace continents are the same as those which produce great fold-mountain ranges. Continental drift, faults and compressions, earthquakes, volcanicity, transgression cycles, and polar wondering are undoubtedly connected causally on a grand scale. Their common intensification in certain periods of the earth’s history shows this to be true. However, what is cause and what effect, only the future will unveil.”
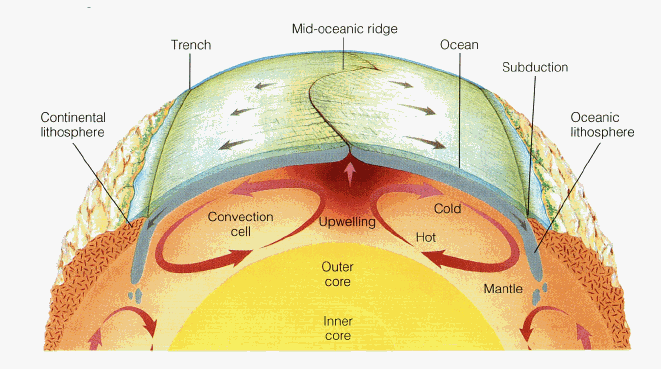
Figure 3.3. Illustration of mantle convection as the driving mechanism underlying plate tectonics (Byrd, n.d.)
With advances in technology and increased understanding about the way that earth’s magnetic orientation changes periodically, bands of oceanic crust were discovered with alternating magnetic alignments, creating stripes as it were, symmetrically about the mid-ocean ridges. The creation of new oceanic crust at these oceanic crust centers must be balanced by destruction of old crust. Thus, the driving force of mantle convection was deduced.
Together, this mantle convection and the observation that the earth’s continents appear to fit like puzzle pieces fomented a scientific revolution. Plate tectonics emerged as a dominant geologic theory in the mid-twentieth century.
“The Himalayas are the crowning achievement of the Indo-Australian plate. India in the Oligocene crashed head on into Tibet, hit so hard that it not only folded and buckled the plate boundaries but also plowed into the newly created Tibetan plateau and drove the Himalayas five and a half miles into the sky. The mountains are in some trouble. India has not stopped pushing them, and they are still going up. Their height and volume are already so great they are beginning to melt in their own self-generated radioactive heat. When the climbers in 1953 planted their flags on the highest mountain, they set them in snow over the skeletons of creatures that had lived in a warm clear ocean that India, moving north, blanked out. Possibly as much as 20,000 feet below the sea floor, the skeletal remains had turned into rock. This one fact is a treatise in itself on the movements of the surface of the earth. If by some fiat, I had to restrict all this writing to one sentence; this is the one I would choose: the summit of Mount Everest is marine limestone.”
—John McPhee, Annals of the Former World
PLATE BOUNDARIES
There are three types of plate boundaries: convergent (plates that are moving toward one another), divergent (plates that more moving away from one another), and transform (plates that move past one another) (Fig. 3.4). Convergent plate boundaries can be further subdivided into three categories, classified by what types of plates are converging. Oceanic-oceanic convergent boundaries, where one oceanic plate subducts below another result in ocean trenches and volcanic arc island chains. Oceanic-continental convergent boundaries, where the denser oceanic plate subducts below the less dense continental plate result in trenches, accretionary wedges, and volcanic arcs. Continental-continental convergent boundaries result in crustal thickening and mountain range building. Divergent boundaries result in mid-ocean ridges between two oceanic plates or in rift zones between two continental plates.
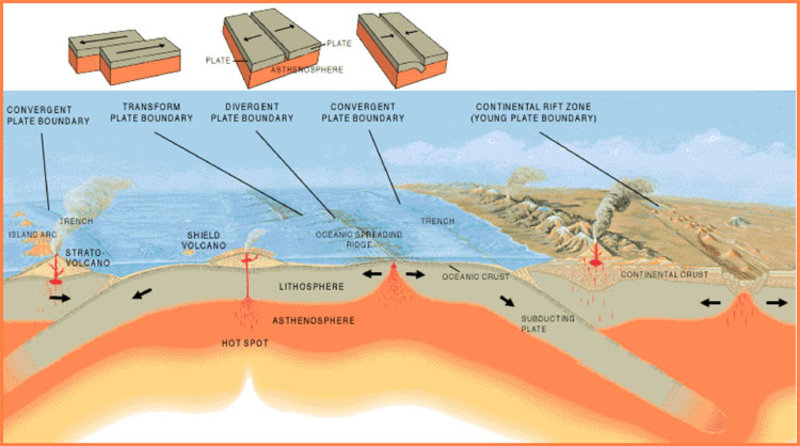
Figure 3.4. The three types of plate boundaries in context of a cross-section of Earth (NOAA, n.d.)
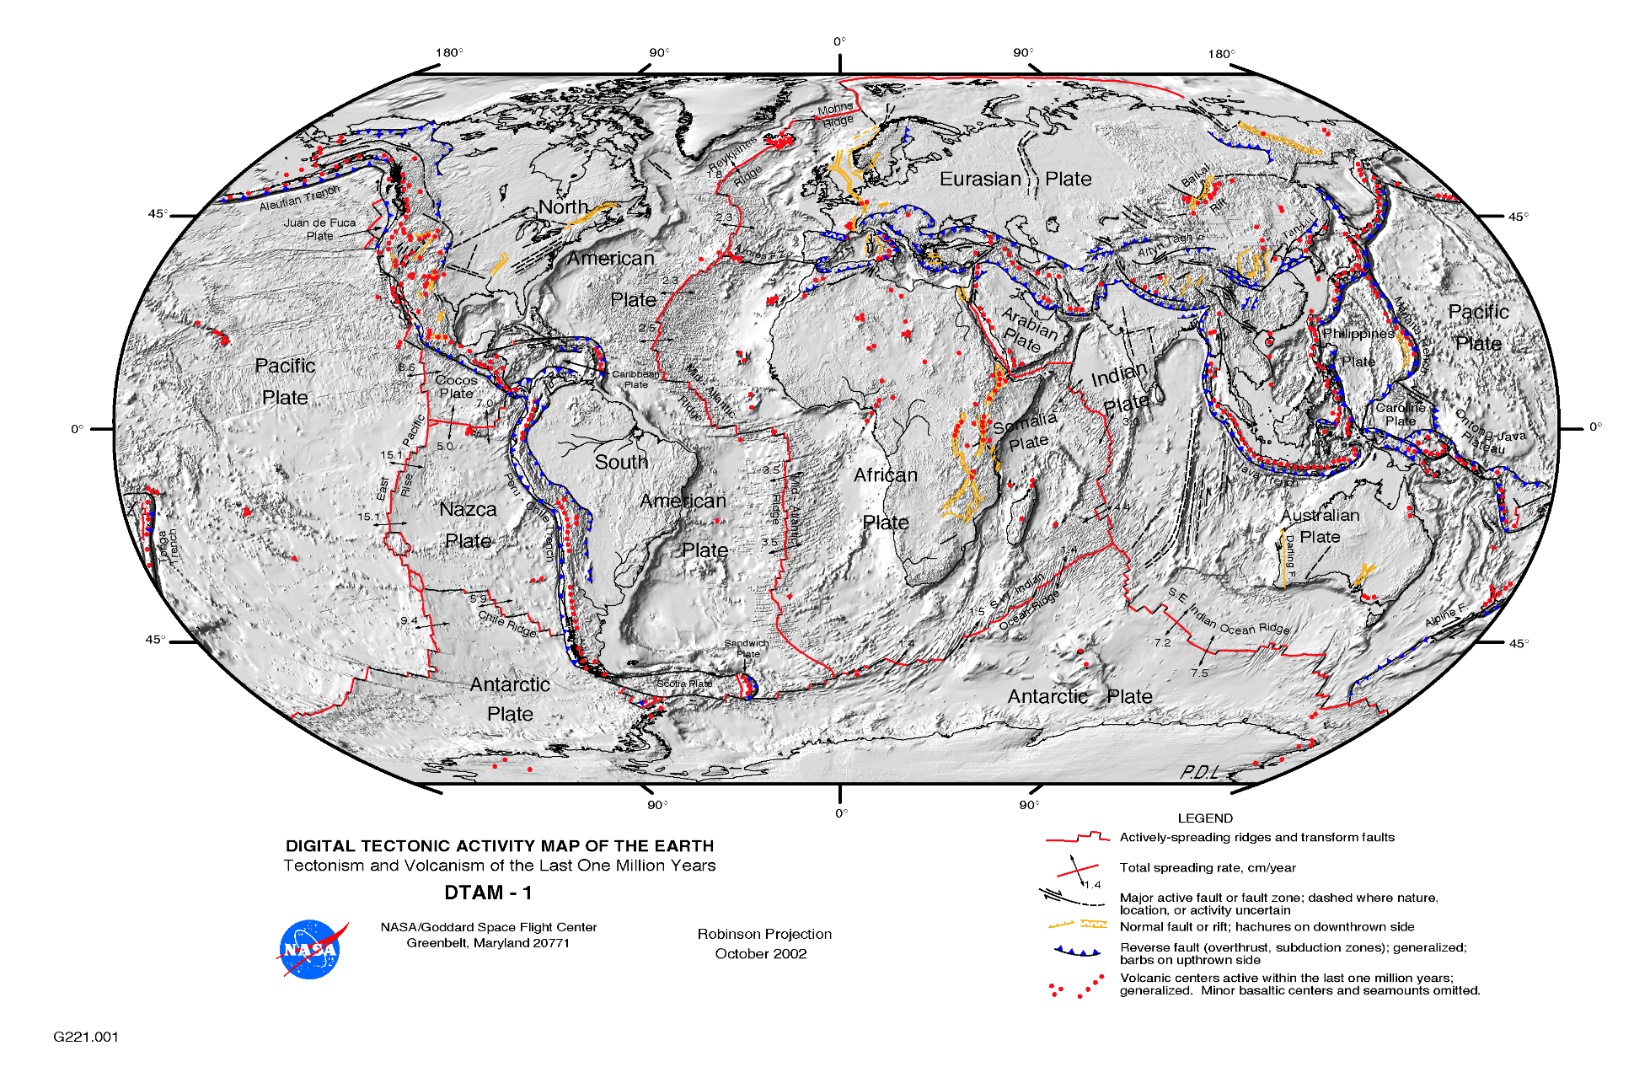
Figure 3.5. Digital Tectonic Activity Map which depicts crustal motions, seismicity, earthquakes, & continental and oceanic crust (Lowman and Yates, 2002)
Lab Activity A: The Rock Cycle and Earth’s Crust
A Closer Look at the Rock Cycle
-
Examine the igneous, sedimentary and metamorphic rock samples provided. Discuss with your classmates some of the similarities and differences that you can directly observe between the three rock types. Then, discuss the processes that lead to the formation of each rock type.
1a) List at least one characteristic that makes each rock type distinctive. Conversely, what is similar about all three rock types?
1b) List at least 1 process each that could lead to the formation of an igneous rock, a sedimentary rock, and a metamorphic rock.
Density of Earth’s Crust
-
The Earth’s crust can be divided into two categories: Oceanic and Continental.
Continental crust is composed primarily of granite
Oceanic crust is composed primarily of basalt
Though both granite and basalt are igneous rocks, they have different chemical compositions. Both basalt and granite are mostly composed of silicate minerals: basalt is generally about 50% SiO2, while granite is usually about 70% SiO2. Basalt is more enriched in calcium, iron, and magnesium, while granite, has greater percentages of aluminum, potassium, and sodium. (Take a look at the periodic table of the elements—https://pubchem.ncbi.nlm.nih.gov/periodic-table/—to determine which of these elements are denser than others.)
Look at the samples of granite and basalt provided. Note your observations about each type of rock.
Granite
Basalt
Scientific hypothesis: Based on hefting the samples and considering the periodic table, which of these two rocks do you think is denser (heavier per unit size)?
Test with Experimentation: Calculate the density of 2 basalt and 2 granite samples using the equation,
ρ=m/Vand filling in the chart below. To obtain mass, there is one scale in the classroom so you will need to share with the other groups. To calculate volume, you will use a water displacement method. Recall that for water, 1 mL = 1 cm3.
Sample name/Rock type
Mass (m, g)
Volume (V, mL)
Density (ρ=m/V, g/cm3)
Analyze the results and draw a conclusion based on your experiment above. Was your hypothesis correct?
Communicate with your classmates to compare results. Are your calculated density measurements the same? If not, list 2 possible sources of error.
Lab Activity B: Earth’s Interior Structure
Objective
By constructing a scale model of a cross-section of the interior of the Earth, students will have the opportunity to increase their understanding of the layered structure of Earth’s interior, and its relationship to plate tectonics and the occurrence of earthquakes and volcanoes. This activity also provides practice with the concept of scale.
Materials
- Large piece of paper
- Ruler
- Pencil
- Colored pencils, crayons or markers
Procedure
Draw a scaled outline for your diagram of the interior of the Earth. We will be using a 1:1,000,000 scale. Another way to put this is 1 cm = 100 km, or each centimeter on your diagram represents 100 km inside Earth.
The Earth’s true radius is 6371 km. So, if each 100 km = 1 cm, then 6371 km = _________ cm.
Draw this radius 3 times,

and then connect the radii with an arc to represent Earth’s surface.

This is a good time to add a scale bar to your illustration. Here is an example of a scale bar. You can make one this this, or it can be a different design. The important thing is to have 1 cm marks and make it known to the illustration viewer that 1 cm = 100 km.

Along each of the radii, use the table of data included in this activity to mark the depths of the boundaries between each of Earth’s interior layers.
Label the boundaries and the layers of the Earth between those boundaries. Here are suggested colors for each layer to enhance visibility and imply relative temperature in the Earth’s interior, but you may use whatever color scheme pleases you:
|
Layer |
Suggested color |
|
Inner core |
white |
|
Outer core |
yellow |
|
Lower mantle |
orange |
|
Asthenosphere part of upper mantle |
red |
|
Lithosphere (rigid part of upper mantle + crust) |
brown |
Table. Earth’s Interior Structure
|
Actual depth (km) |
Scaled depth (cm) |
Layer |
Boundary |
Material |
Average density (g/cm3) |
|
0 |
0 |
|
Earth’s surface |
air/solid |
|
|
0-35 |
0-0.35 |
Crust (part of the Lithosphere) |
|
solid (SiO2-rich) |
2.8 |
|
35 |
0.35 |
|
Moho |
solid/solid |
|
|
35-100 |
0.35-1.0 |
Upper mantle portion of the Lithosphere |
|
solid (Fe and Mg silicates) |
3.3 |
|
100 |
1.0 |
|
Lithosphere/ Asthenosphere |
Rigid solid/flowy solid |
|
|
100-670 |
1.0-6.7 |
Rest of the upper mantle = Asthenosphere |
|
solid (Fe and Mg silicates) |
4.2 |
|
670 |
6.7 |
|
Upper/lower mantle |
solid/solid |
|
|
670-2885 |
6.7-28.9 |
Lower Mantle |
|
solid (Fe and Mg silicates) |
5.0 |
|
2885 |
28.9 |
|
Mantle/core boundary |
solid/liquid |
|
|
2885-5155 |
28.9-51.6 |
Outer Core |
|
liquid iron |
11.0 |
|
5155 |
51.6 |
|
Outer/inner core boundary |
liquid/solid |
|
|
5155-6371 |
51.6-63.7 |
Inner Core |
|
solid iron |
13.5 |
|
6371 |
63.7 |
|
Center of the Earth |
|
|
Lab Activity C: Plate Tectonics
- To answer these questions, view this paleogeographic animation (https://drive.google.com/file/d/1DO1hNFPxbCs8r3IZ-ajuoljmH4ivSx_5/view), that shows the paleogeography of the North Atlantic during the last 290 million years.
- Can plate movement over time be best described as simple horizontal or vertical movements, as rotations, or both?
- What type of plate margin was eastern North America during the early stages of plate movement (convergent, divergent, or transform)?
- In relation to North America, where was Africa located 250 million years ago?
- Describe the continent of Africa’s subsequent movements.
2. Age of the Oceanic Crust.
- Referring to Figure 3.6, what color represents the youngest oceanic crust?
- What color represents the oldest oceanic crust?
- Now compare Figure 3.6 with Figure 3.5. What kind of boundary is associated with the youngest oceanic crust?
- How is crust formed at this type of boundary?
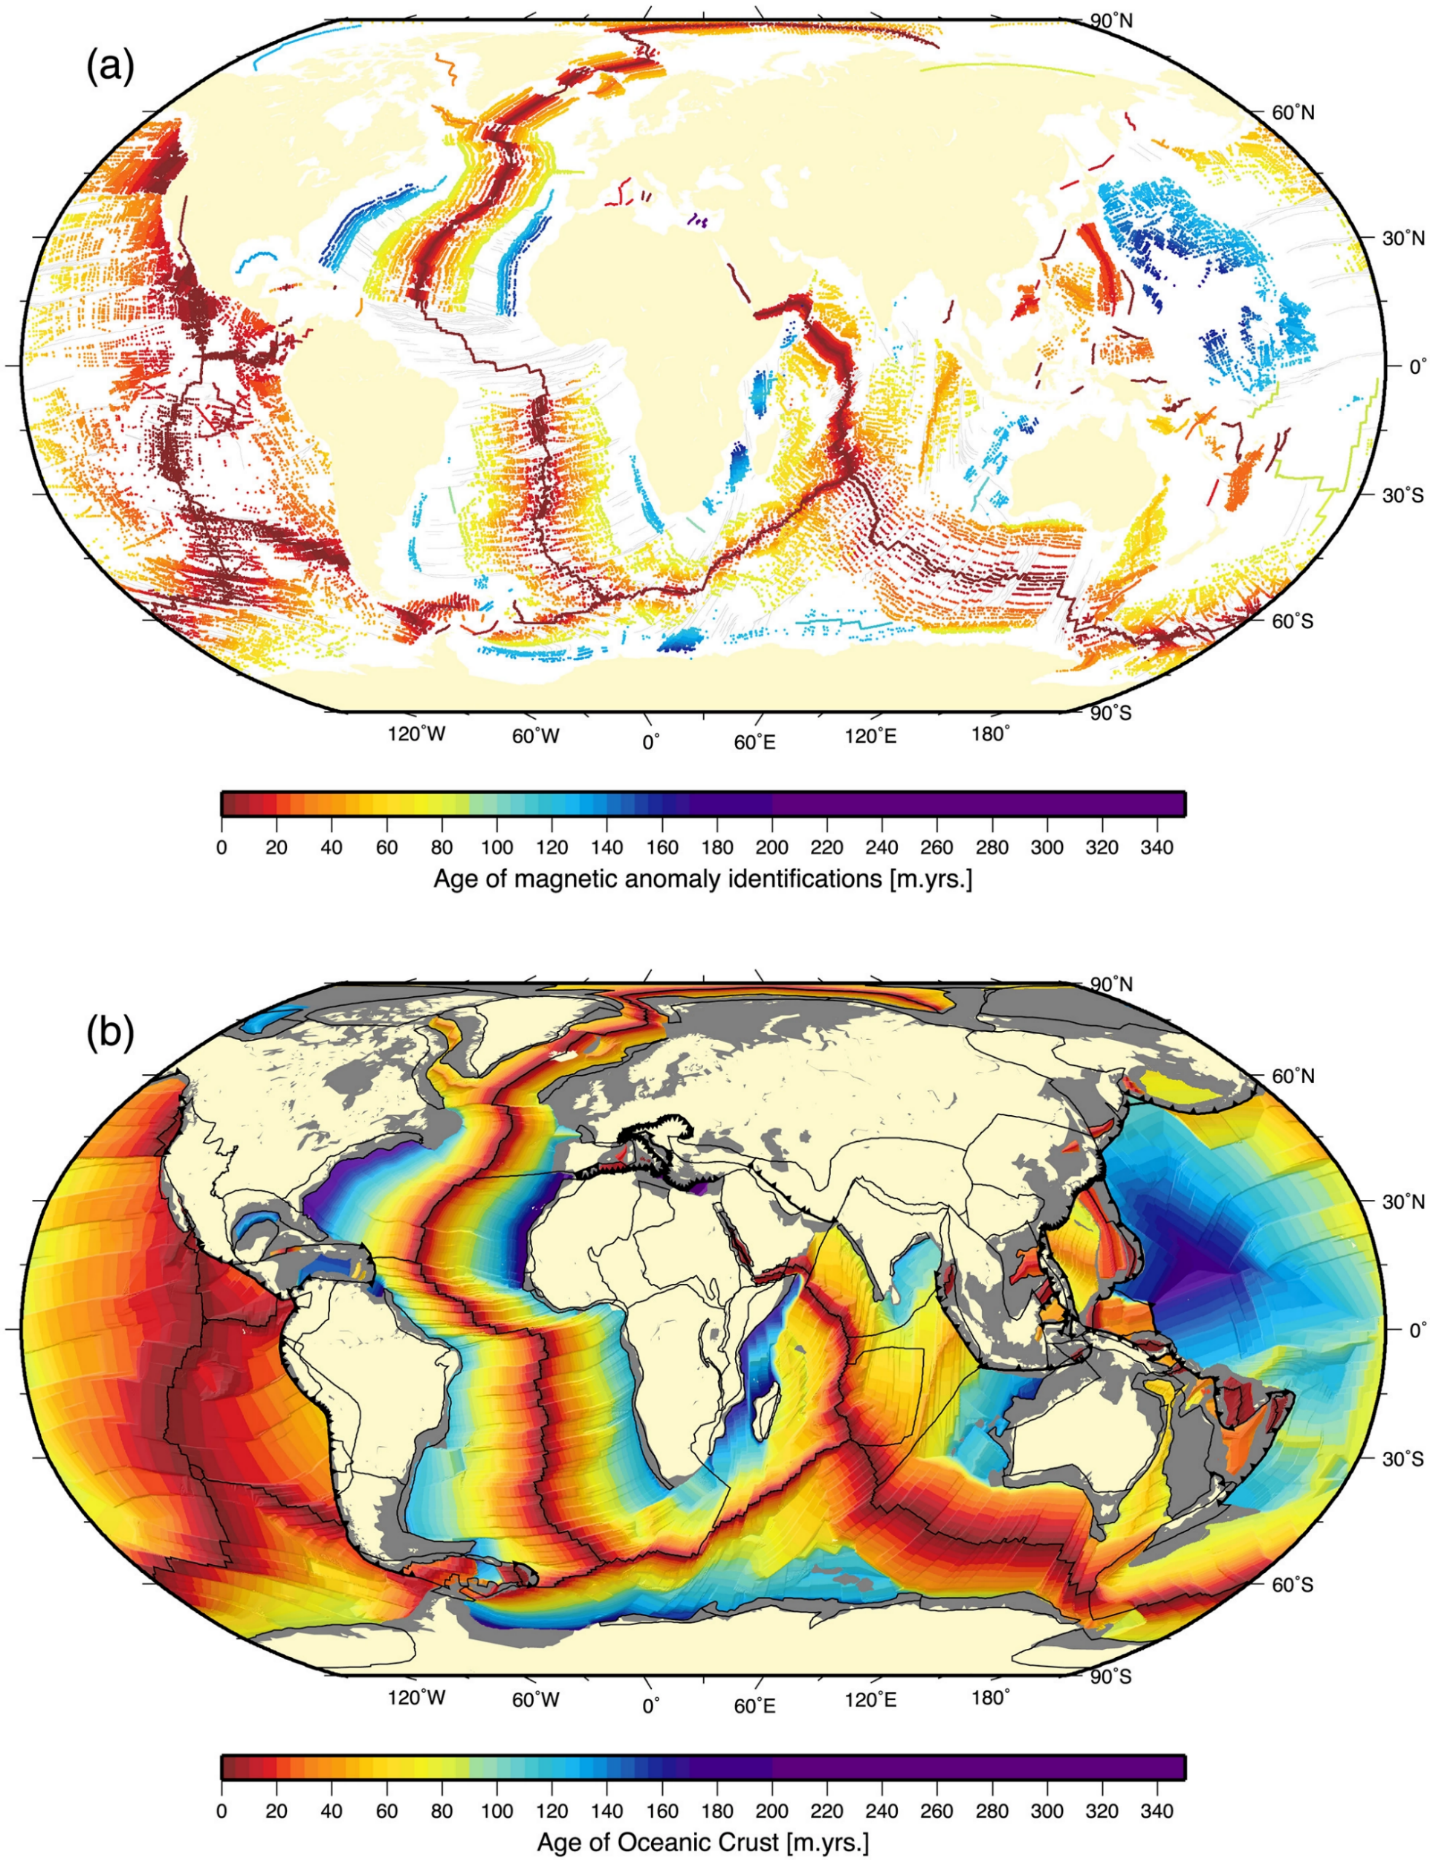
Figure 3.6. Map of the age of oceanic crust (Seton et al., 2020).
3. Volcanoes Around the World (refer to Figure 3.5)
- Describe any relationship you see on Figure 3.5 between the locations of volcanic chains and plate boundaries? Specifically, what is the relationship between the locations of volcanoes and the types of plate boundaries?
- Name two locations on the map where volcanoes/volcanic chains do not follow the trend described in the answer to the above question. What, then, accounts for the locations of these volcanoes/chains?
4. Earthquakes Around the World (refer to Figure 3.7)
- Which colored circles represent the deepest earthquakes?
- Describe any patterns or trends you observe in the location of earthquakes around the world.
- Now compare Figure 3.7 with Figure 3.5. What kind of plate boundaries are associated with shallower earthquakes? What kind of plate boundaries are associated with deeper earthquakes?
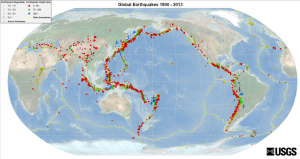
Figure 3.7. Global earthquakes, magnitude 7.0 and greater, 1900–2013 (USGS, 2019).
Lab Activity D: Hawaii—An Oceanic Hotspot
Figure 3.8 shows the distribution of the Hawaiian Islands Chain and the Emperor Seamount Chain. For questions 12 through 25, refer to the bottom portion of Figure 3.8. The numbers indicate the age of each island in millions of years, obtained from the basaltic igneous rock of which each island is composed.
Using the scale bar on Figure 3.8, how many kilometers are represented by each inch on the map?
- What is the distance (in km) from the Big Island of Hawaii to Kauai?
- Divide the distance you measured for question 13 by the amount of time elapsed between the formation of those two islands. What was the average rate of plate motion in km/m.y. from 4.7 million years ago to the present day?
- Convert that rate to cm/yr.
- Recall that the hot spot is stationary beneath the crust and that the Pacific Plate has been moving over that hotspot. What has been the direction of motion of the Pacific Plate?
- Has this rate and direction been constant through time? Let’s look at this island chain during two different time frames: first from 4.7 to 1.6 million years ago, then from 1.6 million years ago to the present. What is the distance (in km) from Molokai to Kauai?
- What was the rate of plate motion in km/m.y. from 4.7 to 1.6 million years ago?
- Convert that rate to cm/yr.
- What was the direction of plate motion from 4.7 to 1.6 million years ago?
- What is the distance (in km) from the Big Island of Hawaii to Molokai?
- What has been the rate of plate motion in km/m.y. from 1.6 million years ago through the present?
- Convert that rate to cm/yr.
- What was the direction of plate motion from 1.6 million years ago through the present?
- How does the rate and direction of Pacific Plate movement during the past 1.6 million years differ from the older rate and direction (4.7–1.6 m.y.) of plate motion?
- Locate the Hawaiian Islands Chain and the Emperor Seamount Chain in the upper part of Figure 3.8. How are the two island chains related?
- Based on the distribution of the Hawaiian Islands and Emperor Seamount chains, suggest how the direction of the Pacific plate movement has generally changed over the past 60 million years.
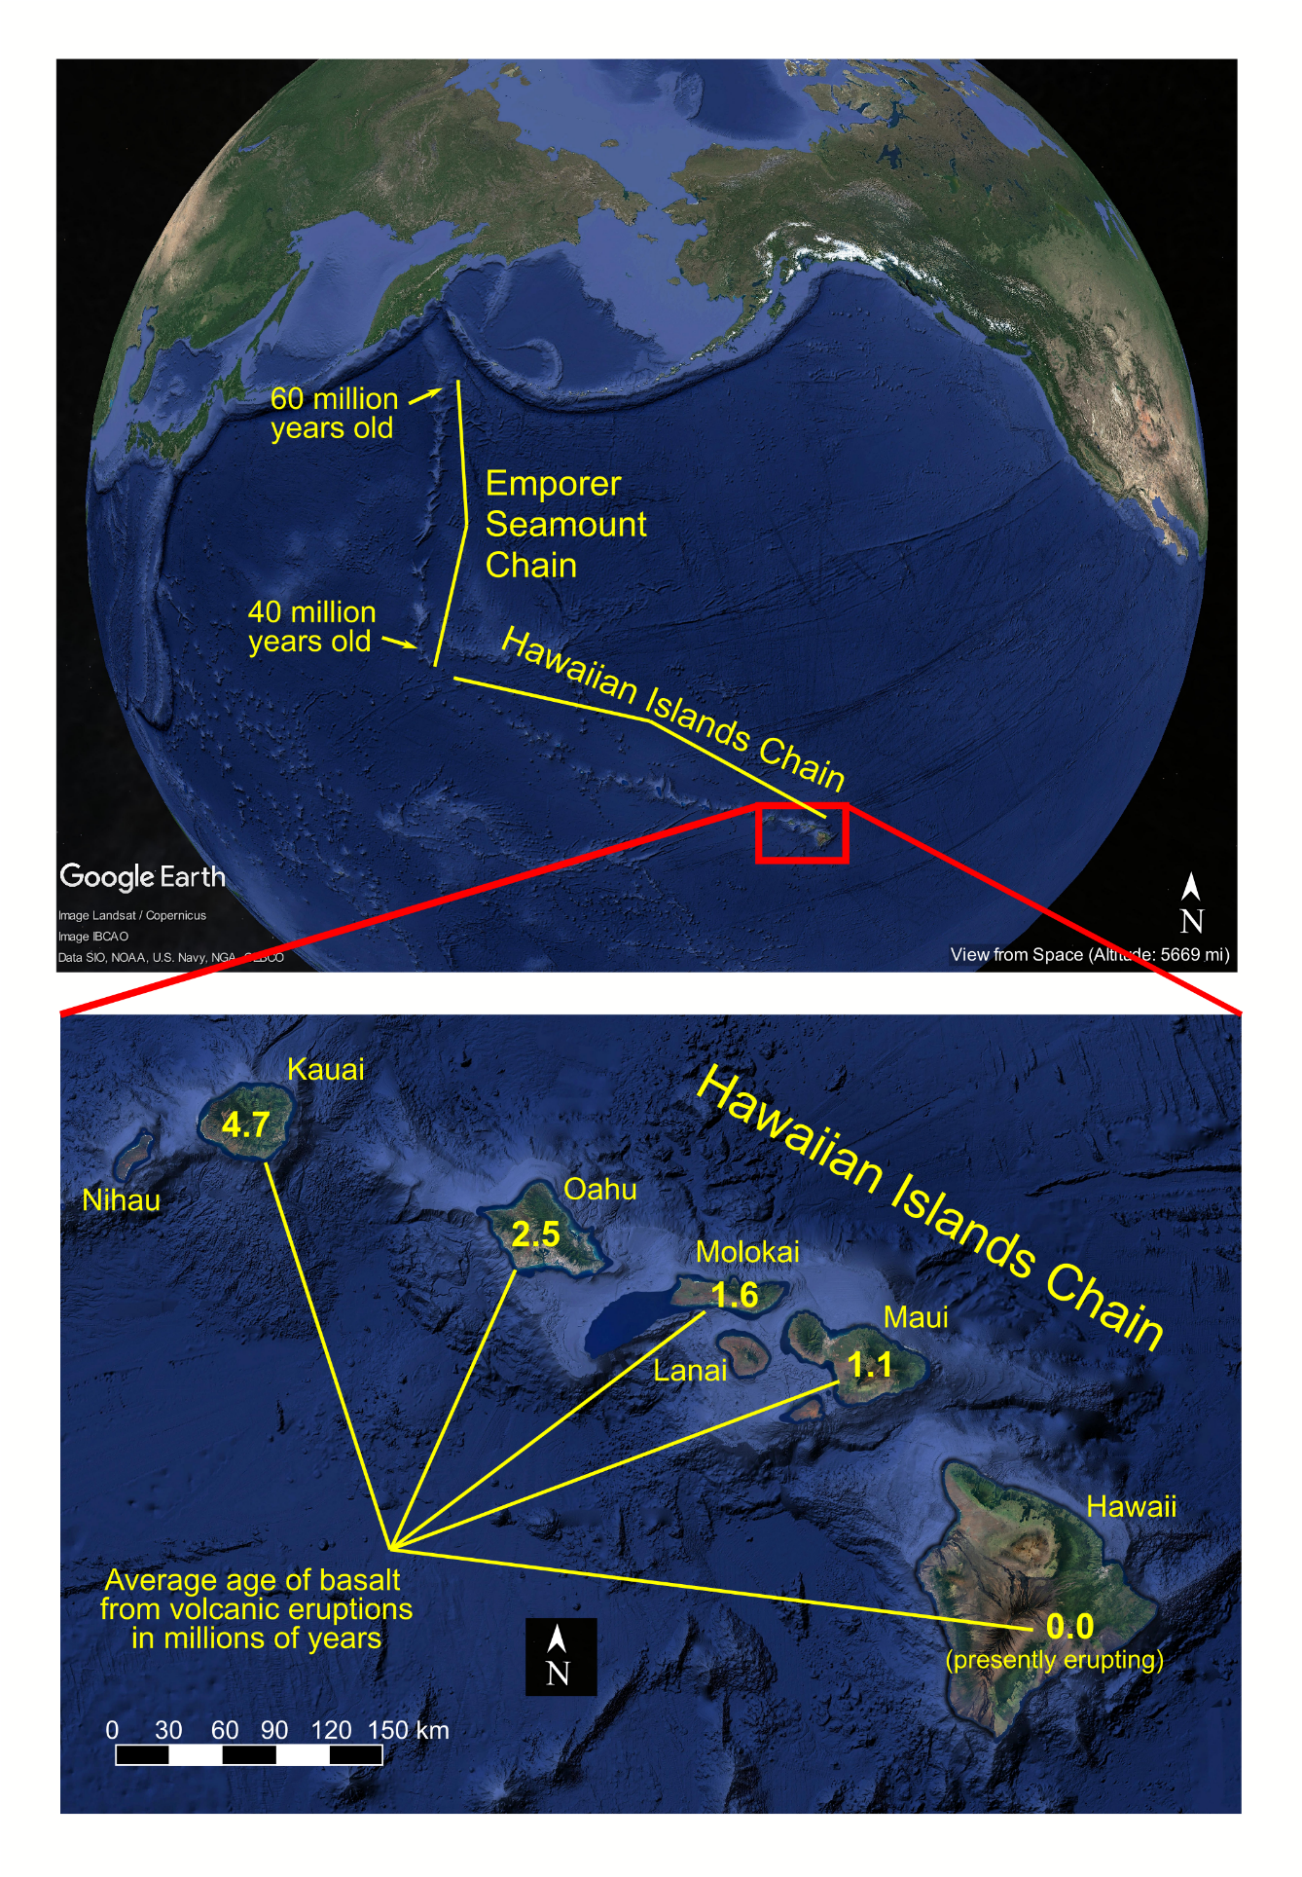
Figure 3.8. Top: In the North Pacific Ocean, the Emperor Seamount Chain and Hawaiian Islands Chain preserve evidence of tectonic plate motion over a volcanic hot spot. Bottom: A zoomed in view of the southeastern most extent of the Hawaiian Islands Chain. The age in millions of years is indicated on each island.
Lab Activity E: Yellowstone—A Continental Hotspot (refer to Figure 3.9)
Now let’s apply this analysis of hotspots to an example on a continental tectonic plate. Another good example of a hotspot is currently evident at Yellowstone National Park. Although there are no volcanoes currently erupting in Yellowstone today, there are hot springs and geysers. For a reconstruction of the track of this hotspot on the North American plate, see Figure 3.9.
- Based on the ages and location of each Yellowstone Hot Spot Deformation Zone, what direction is the North American Plate moving?
- What is the average rate in cm/yr. that the North American Plate has moved over the past 16 million years?
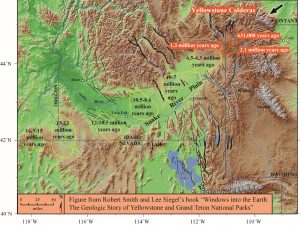
Figure 3.9. Yellowstone Calderas and dated volcanic features of the Snake River Plain, preserving evidence of the North American tectonic plate’s motion over the Yellowstone hotspot (USGS, n.d.).
REFERENCES
Byrd Polar Research Center, Ohio State University, “Mantle Convection Cell,” http://research.bpcrc.osu.edu/education/rr/plate_tectonics/mantle_convection_cell.gif; last access: 2022-07-01.
Lowman, Paul and Jacob Yates, 2002, “Digital Tectonic Activity Map,” https://visibleearth.nasa.gov/images/88415/digital-tectonic-activity-map; last access: 2022-07-05.
McPhee, John. Annals of the Former World. Farrar, Straus and Giroux, 2000.
Meghani, Nooreen. “Earth Layers Schematic.” 2016. https://www.e-education.psu.edu/marcellus/node/870.
NOAA, “Image of the three main types of plate tectonic boundaries,” https://oceanexplorer.noaa.gov/facts/media/plate-boundaries-800.jpg; last access: 2022-07-01.
Panchuk, Karla, 2019, “6.2 The Rock Cycle,” in Physical Geology, First University of Saskatchewan Edition, https://openpress.usask.ca/physicalgeology/chapter/6-2-the-rock-cycle/; last access: 2022-07-01.
Seton, Maria, R. Dietmar Müller, Sabin Zahirovic, Simon Williams, Nicky M. Wright, John Cannon, Joanne M. Whittaker, Kara J. Matthews, and Rebecca McGirr, 2020, “A global data set of present‐day oceanic crustal age and seafloor spreading parameters,” Geochemistry, Geophysics, Geosystems 21, no. 10, https://doi.org/10.1029/2020GC009214; last access: 2022-07-05.
United States Geological Survey (USGS), 2019, “Global Earthquakes, 1900–2013,” https://commons.wikimedia.org/wiki/File:EQs_1900-2013_worldseis.png; last access: 2022-07-05.
United States Geological Survey (USGS), n.d., “Track of the Yellowstone hotspot,” https://www.usgs.gov/media/images/track-yellowstone-hotspot; last access: 2022-07-06.
Wegener, Alfred. The Origin of Continents and Oceans. Courier Corporation, 1966.
