5 THEME 5: THE PRODUCT OF COLLEGE ATHLETICS
Learning Objectives
*Understand the definition of sports products and categorizations of products and services
*Discover the branding concepts and process
*Discuss the product life cycle and factors that lead to innovation and diffusion of new products
*Identify various dimensions of collegiate athletics as a sports product and managing process of this product
Introduction of General Product Concepts
The Nuts and Bolts of Sports Products
Sports products come in all types and forms, such as games or contests, equipment and apparel, memorabilia, memories (records and stats) and experiences, novelties and fantasies, venue, tickets and printed materials, electronic products, services provided by organizations and personnel, modern digital technologies, signage, entertainment and engagement activities, media exposure, and star athletes (Dees et al, 2021). Parkhouse et al. (2012) summarize the aforementioned types of products into four main groups: (1) sports league/event, (2) sports accessories, (3) sports participation, and (4) sports sponsorship. Technically, sports products can be classified into goods, services, or a combination of the two that are designed to provide benefits to a sports spectator, participant, or sponsor. Goods are defined as tangible products with physical features. Services, as opposed to goods, are intangible (cannot be seen, felt, or tasted), less standardized (difficult to maintain a quality level), but heterogeneous (easy to detect the variability), perishable, and inseparable (simultaneous produce and consume) from the provider. A unique feature that distinguishes goods from services is separability. When a spectator attends a basketball game, his/her experience about the game/competition can be separated from the service that he/she receives from the parking service or concession sales. In general, tangible products may come with certain standard forms of size or quality. However, for the sporting events and competitions, winning and playing effort often cannot be guaranteed, thus it makes the quality of games very inconsistent and unpredictable. Notice the Minor League Baseball tends to focus on selling the family entertainment and experience to their fans (Williams, 2015). From this perspective, making the fans enjoying the games they have attended is a way to demonstrate the good quality of service.
(Q1) The characteristics of services as compared to goods may include:
(a) intangible
(b) less standardized
(c) inseparable
(d) all of the above
FYI. Modern technologies and products
Nike, Fuel Band
Nike SPARQ
Nike Pro Combat with Oregon Ducks American football uniform
MiCoach and F50 of Adidas
The Sports Product Mix
In addition to goods-services for categorizing products, the sports product mix concept is another method to address the breadth and width of the products (Parkhouse et al., 2012). The term product mix refers to all the different products and services a firm offers. Product line is organized by groups of individual products that are closely related in some way. Product item is any specific version of a product that can be designated as a distinct offering. The authors will use three specific organizations’ offered products or programs to illustrate the concepts and terminologies of sports product mix (see Table 1)
Table 1. Concepts and terminologies of Sports Product Mix
| ESPN | Nike | Morehead State University Athletics | |
| Product Mix | ESPN, ESPN2, ESPNU, ESPN Radio, ESPN Deporte, ESPN Classics and others | Basketball shoes, running shoes, cross training shoes, soccer shoes, etc. | 14 men’s and women’s varsity sport programs |
| Product Line | Within ESPNU: All SEC sport events | Within Basketball shoes: Kyrie 4, LeBron15, ZoomKDX, etc. | Within Basketball: Men’s Basketball and Women’s Basketball |
| Product Item | ESPN ESPY Awards, ESPN Magazine | SB Stefan Janoski Max (Skateboarding shoe) | Cheerleading |
(Q2) The total assortment of product lines that a sport organization (Nike, Reebok, Wilson) sells is the _____.
-
- product characteristics
- product brand
- product mix
- product trademark
- product line
Product Characteristics
Product characteristics are the important attributes, when taken together, create the total product (Shank & Lyberger, 2015). It is suggested that each total product is composed of three unique attributes (or characteristics), branding, quality, and design. In the following paragraphs, the authors will address each of the three attributes in detail.
(a) Branding
A brand is a verbal or visual presentation of a sports product. That presentation may contain a brand name, slogan, mark or logo, and trademark. A brand name is important because it may symbolize the strength of the product (or the manufacturer/organization) and reflect the consumers’ confidence in the product (or service). While developing a brand name, it is important to make it easy to say and generates positive feelings and associations toward the representing product. Sports marketing is more complicated than putting a logo on a shirt (Fry, 2002). The words used to describe the brand name should be translatable into a successful and visually appealing logo. Both brand names and logo symbolize the consistent quality, standards, and values of the product or service provided by the organization. Trademark is the name, word, or logo that is legally registered for identifying a particular manufacturer or product and prevent others from using it (Shank & Lyberger, 2015). In America, a trademark can be registered with the US Patent and Trademark Office. The term of protection for design patents is 14 years from the date of filing (35 U.S. Const. §173) In Table 2, readers can find examples of the famous brand names and trademarks of sports organizations in America.
Table 2. Examples of the Famous Brand Names
| Brand Name and Organization | Logo or Mark |
| Nike | |
| NFL | |
| Alabama Crimson Tide | |
| Ohio State Buckeyes |
Branding refers to the process of using name, design, symbol, or any combination of these three to differentiate one’s product from other products. In general, the branding process involves the following four basic steps: (1) generating brand awareness; (2) building brand image; (3) enhancing brand equity; and (4) ensuring brand loyalty. When an organization tries to position its brand into the consumers’ mind, they must let consumers have the ability to be aware and recognize the brand in a variety of settings. So, the consumers can create a memory (or image) about the brand’s name, mark, logo, and quality. Once the image is committed to memory, the consumer will perceive an actual or a relative value of the product or organization. This perception may trigger the consumers’ desire to consume the product (or service) and create financial profits for the organization. This perceived value is referred to as the “brand equity”. When consumers begin to consistently and repeatedly purchase a brand product, then the “brand loyalty” is demonstrated and enhanced. Therefore, organizations spend considerable effort in engaging brand positioning to capture the consumers’ loyalty at a young age. Thus, they will be lifelong consumers of the identified products and contribute to the financial stability of the organization (or manufacturer).
Many brand studies are available that guide the consumers and marketers understanding of the impact of brands and effectiveness of branding strategies. Strong brands can guarantee repeated purchases, help the organization (or manufacturer) endure crisis, and build traditions. The “signaling” concept is a theory that is introduced to detect and analyze the frequencies and contents of the sending messages. Agencies will review the perceptions on message boards by using official and independent online technologies. In collegiate athletics, there are clearly different brand images that BCS and FBS schools have presented. Spectators have also developed different brand perceptions about these two types of schools based on performance level, budgets, and exposure through broadcasting hours. There are also many organizations and useful websites that help individual athletes promote their celebrity status as a brand to sell or endorse products. For examples, GMA (Celebrand assessment tool), Brand Science Inc., Q score, and Celebrity DBI are all popular.
http://login.celebritydbi.com/
FYI; Top-10 Biggest Sports Brand in 2017
No. 1 Nike ($17.3 billion), No. 2 ESPN ($15 billion), No. 3 Adidas ($7.1 billion), No. 4 SkySports ($4.1 billion), No. 5 UnderArmour ($3.7 billion), No. 6 Reebok ($1.1 billion), No. 7 Yes Network ($625 million), No. 8 NESN ($510 million), No. 9 Major League Baseball Advanced Media ($480 million), and No. 10 MSG Network ($300 million)
And an interesting note:
The Long Beach Armada professional baseball team may have the longest name among any professional sports clubs in the world. Its official name is “Long Beach Armada of Los Angeles of California of the United States of North America Including Barrow, Alaska”. The franchise’ name become the longest one as the Armada partnered with Barrow, Alaska.
| NFL as a Brand
National Football League is the wealthiest professional sports league in the world. It generated $16 Billion in revenue as of 2023. Dallas Cowboys, the team with highest valuation, alone would be 5th largest league in the world with $8 billion. Even the least wealthy team, Cincinnati Bengals has a franchise value of $3 billion. The league’s marketing strategies focuses on eight specific areas: (1) branding and image, (2) broadcast partnerships, (3) social media and digital presence, (4) community engagement, (5) merchandising and licensing sales, (6) events and spectacle, (7) Fantasy Football, and (8) sponsorships and general partnerships.
Source: The Brand Hopper. (2023, October 17) https://thebrandhopper.com/2023/10/17/the-nfl-playbook-for-marketing-strategies-that-win-big/ |
(Q3) _____ is the value that the brand contributes to a product in the sport market place.
- (a) Brand equity
- (b) Brand image
- (c) Brand awareness
- (d) Branding loyalty
- (e) None of the above
(Q4) Product design for sports products includes _____.
- (a) aesthetics, style, and functionality
- (b) aesthetics, style, and color
- (c) style, functionality, and usefulness
- (d) aesthetics, usefulness, and color
- (e) none of the above
(Q5) According to the text, sports products, such as bowling and billiards, are trying to _____ themselves as “yuppie sports activities” by creating trendy and up-scale environments for sports.
- (a) develop
- (b) position
- (c) reposition
- (d) create
- (e) none of the above
Licensing is a contractual agreement whereby a company (a sports team, an organization, or player) may use another company’s brand name and logo (trademark) in exchange for a royalty or fee. Any organization (Licensee) who wishes to use other’s name, logo or trademark must purchase a license from the brand company (Licensor). It is not only a way to protect an organization’s brand, but also a lucrative way to generate revenues for the licensor (including player, union, team or league). While producing licensing merchandise to sell under the rights of the agreement, licensee (a manufacturer) usually pay about 10-15% of profits as the royalty fee. The Lanham Act is federal law commonly used to protect licensed products from infringement.
According to the report of Ibid, sports accounted for approximately $12.6 billion in retail sales with royalties of $685 million. Kolah (2005) stated the licensing and merchandising of sport brands was a highly sophisticated $17 billion business. The collegiate merchandises alone accounted for $3.8 billion with royalties of $206 million. Licensing is proving to be a booming business as the National Football Association (NFL) creates 175 licenses and sell more than 2,500 products such as apparel, sporting goods, and collectibles. About $200 million of NFL merchandise was sold in 2001 (Kolah, 2005). Global-wise, the National Basketball Association has 150 licenses and aims to generate $13.65 billion. According a 2017 report by the Sport Business Research Network (SBRnet), MLB (28.0%) and NFL (27.9%) fans were more likely to purchase sports logo apparels, whereas MLS (12.5%) fans were least likely. Among all league products, two largest age groups who purchased sport logo apparel were 18-24 and 25-34. Fans older than 50 tended to lag behind. Readers can find the total consumer expenditures for licensed logo apparels among top sports leagues in America (Table 3).
Table 3. Total Consumer Expenditures for Licensed Apparels (2015 SBRnet report)
| Rank | League Brand | Value |
| 1 | NFL | $3.2 billion |
| 2 | MLB | $2.4 billion |
| 3 | NBA | $1.1 billion |
| 4 | NHL | $0.9 billion |
| 5 | MLB | $0.3 billion |
| FYI: Examples of NFL’s Licensing Partners (The Brand Hopper, 2023)
*Nike and Under Armor *NFL Green *Augmented Reality experience within mobile app *NFL Fantasy |
Top-5 Licensed Brand Properties (coming from another source)
| Rank | League Brand | Value |
| 1 | MLB | $5.28 billion |
| 2 | The Collegiate Licensing Company | $4.62 billion |
| 3 | NFL | $3.25 billion |
| 4 | NBA | $3 billion |
| 5 | NASCAR | $1.3 billion |
FYI. Major sports organizations’ licensing contracts (Fullerton, 2022)
| Licensor | Licensee | Products |
| NFL | Nike | Apparels |
|
MLB
|
Fanatics | COVID-19 masks |
| Majestic | Uniforms and replicas | |
| Bank of America | Mastercard | |
| Crocs | Footwear and shoe charms | |
| Take 2 Interactive Software | Video games | |
|
NBA |
Champion Europe | Apparels |
| Take 2 Interactive Software | NBA 2K video games | |
| Fanatics | COVID-19 masks | |
| NHL | The Hockey Company | Sticks, helmets and jerseys |
| Adidas | Apparels and jerseys | |
| NASCAR | Mattel | Toy cars |
| Dow Automotive | Performance Product | |
| PGA | Callaway | Golf balls, bags and putters |
| US Olympics | New Era | Headwear, caps, and toques |
| FIFA | EA Sports | Video Games |
FYI: Percent of fans purchasing sport logo apparel (Sport Market Analytics, 2017)
| Item and League | NASCAR | MLB | NBA | eSports | NHL | NFL | MLS |
| T-shirt/Sweatshirt | 72.3% | 62.6% | 58.5% | 57.1% | 56.6% | 61.0% | 40.2% |
| Hat | 33.5% | 41.6% | 30.1% | 29.8% | 30.5% | 38.2% | 23.6% |
| Jersey | 20.0% | 26.9% | 38.0% | 11.8% | 40.5% | 43.4% | 40.4% |
| Shorts/Pants | 16.7% | 9.0% | 18.8% | 16.8% | 8.9% | 15.0% | 16.9% |
| Jacket | 19.6% | 9.1% | 11.4% | 30.6% | 7.3% | 14.3% | 12.6% |
| Socks | 10.7% | 8.9% | 16.8% | 17.0% | 10.8% | 12.5% | 15.4% |
Additional information: Percent of College fans purchasing sport logo apparel
| Item and League | College Football | College Basketball |
| T-shirt/Sweatshirt | 77.4% | 75.5% |
| Hat | 30.4% | 24.1% |
| Jersey | 19.4% | 20.2% |
| Shorts/Pants | 16.2% | 11.2% |
| Jacket | 14.4% | 12.0% |
| Socks | 9.4% | 6.8% |
(Q6) Licensing allows one company to use the _____ of another.
(a) trademark
(b) marketing manager
- (c) service reliability
- (d) None of the above
| Did You Know? History of Licensing
Most credit the start of licensing in sport to a man named David Warsaw. In 1928, Warsaw created an ashtray in the shape of the Chicago Cubs Wrigley Field and placed a Cubs logo on it. He went to the Wrigley family and asked if he could sell them in the stadium. Wrigley agreed to let Warsaw if he paid a royalty on every sale. Warsaw then started his own company called “Sport Specialties” and would go on to work with many professional teams selling merchandise. Here are some key benefits associated with licensing (Fullerton, 2022): For Licensor: Extra revenue, distribution without significant investment, broader product mix, greater public awareness, control of products and their quality/standards, and image protection For Licensee: Extra brand equity, short-term engagement, profit gains, and new price points |
Numerous collegiate athletics affiliated organizations, such as NCAA, the Bowl Championship Series, and Southeastern Conference (SEC), Big 10 conferences, and many individual schools are all growing in licensed merchandise sales. Top collegiate properties include Texas, Alabama, Michigan, Notre Dame, Kentucky, Georgia and North Carolina. The Collegiate Licensing Company (www.clc.com) represents about 200 collegiate properties with many major universities as well. The company has reported more than $4.6 billion in revenues in 2012. Due to the enormous amount of revenues revolving in the licensed merchandise sales, product counterfeit and trademark infringement are also reaching a new height. It is estimated that over $1 billion worth of counterfeit sports products hit the street each year. In 2013, there were 27,119 seized cases of illegally imported fake footwear products globally (OCED, 2016). Because of the pervasive issue of counterfeit products and trademark infringement, the Coalition to Advance the Protection of Sports Logos (CAPS) was formed as early as 1992 to police and investigate illegal activities and violations. The Trademark Licensing Office is another example of license police that protects the brand, image and reputation of the University of Alabama’s (UA) logo. This licensing office works to:
*protect the University of Alabama’s image and reputation;
*ensure all partners that use UA’s trademarks are licensed;
*promote the brand and reputation of Alabama through quality licensed products;
*preserve the value of the University trademarks; and
*provide additional funding for a variety of academic and athletic programs through royalties from the sale of officially licensed products. (Price, 2017).
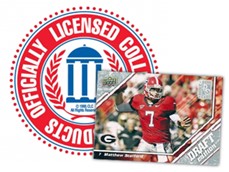
Diagram 1. Officially licensed Collegiate Products
| FYI: How Licensing Works in College?
The NCAA doesn’t actually have full control over its licensing. Its member institutions work with the Collegiate Licensing Company (CLC). The CLC administers the domestic and international programs for the NCAA. There are different types of licensing programs through the CLC: Standard, Restricted, and Local. (a) Standard: for individual and retail products, (b) Restricted: it involves licenses for internal suppliers, and (c) Local: it deals with local companies and individuals. Problems With Collegiate Licensing in the Recent Years In recent years, there has been many legal cases of related to licensing. Student-athletes have seen money going to the pocket of the corporate companies and their athletic department. They want to be compensated by those who use their Names, Images, and Likenesses (NIL) to generate profits. The video game company, EA Sports, was accused for wrongfully using athletes’ NIL to obtain monetary gains. The major concern is that the NCAA is wrongfully using their players for financial benefit and breaking licensing agreements while doing so. |
(b) Sports Product Quality
In terms of the quality of sports product, it is classified in two ways: (1) quality of services, and (2) quality of goods. The sports consumers usually focus on two aspects within the quality of services. There is an expected service level that consumers may pick up from promises of commercials and advertisements or through word-of-mouth from friends or family members. Consumers may also develop their own expectations based on their past consumption experiences. While examining intangible service quality, marketing experts suggested certain dimensions that must be closely addressed. Consumers may pay attention to where the organization has the ability to perform the service dependably, accurately, and consistently. This is known as the “reliability” dimension. The organization must act with responsiveness to provide prompt service to its customers. The organizations’ employees must demonstrate their trustworthiness, knowledge, and courtesy to the consumers. In the meantime, the employees also need to exhibit the quality of empathy by caring and paying individualized attention to their customers.
When consumers judge the quality of tangible goods, they are likely to focus on performance and features of the product, durability, reliability, aesthetic design, and ease of adapting to the product. Interestingly, physical facilities, appearance of personnel, and equipment can be considered as the tangible aspect of service that is offered by sports franchises or fitness industries. To ensure the product quality, manufacturers often issue warranties to indicate their liability concerning any problems with the products. The registration of the warranties is commonly seen when the consumers purchase expensive electronic appliances or hedonic items. Since the counterfeit sports products are commonly found in the market, consumers are informed to closely verify the garment tags and official logo (i.e., holograms on the product or stickers with moving figures). Poor lettering, incorrect color patterns, and background colors bleeding through the overlay are all signs of poor-quality products (Shank & Lyberger, 2015).
(c) Product Design
Product design is closely linked to the product quality and technological environment. In the sporting goods business, product design is associated with the aesthetics, style, and function of the product. Sports marketers understand how product design can affects consumers’ perceptions of sports quality (i.e., improving performance and gaining visual sensation), so they encourage their organizations to monitor and improve technological environment to keep up with the newest trend to attract the consumers. Unfortunately, most of the organizations usually do not invest enough amount of money in research and development area. Today, the direct application of the product design concept is not limited to sporting goods alone. More importantly, we see how many sports facilities and websites illustrate the impact of modern fancy design to capture the consumers’ attention through constructional and digital technologies.
(d) Product Life Cycle
As we all know, the sports industry is constantly evolving. Even with the traditional major sports, such as baseball, football, basketball, and hockey, which have existed for more than a hundred years, changes in rules of plays, facility, and style of games still frequently occur. A certain degree of innovation and change is necessary when new or niche sports are created to gain popularity. As new products enter the sports market, they all begin their product life cycle. Product Life Cycle (PLC) is a useful concept to determine and evaluate the different stages that products pass through from their introduction to elimination. PLC includes four states: (1) introduction, (2) growth, (3) maturity, and (4) decline. According to marketing experts, each life stage has its problems and challenges, thus marketing efforts and profitability of the product may vary in different life cycle stages. They are two classic well-known models illustrating the marketing situations and ideal practices for dealing with each of the four stages. They are proposed by the Boston Consulting Group and Ansoff’s Product-market Expansion Grid.
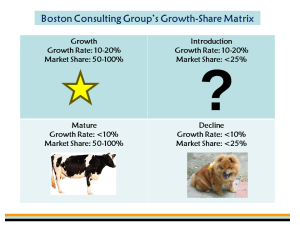
Figure 1. Growth-share Matrix in Different Stages of Product Life Cycle.

Figure 2. Ansoff’s Product-market Expansion Grid
When a product is introduced, it is difficult to know how well the consumers will accept the new product. So the Boston Consulting Group uses a question mark to represent the product’s uncertain future at the introduction stage. Once the product begins to experience success, the adoption pace of the product will expand rapidly (like a rising star) in the “growth” stage. In the “maturity stage,” the growth rate may slow a little bit, but the product will continue to generate strong cash flow. So the symbol of this stage is a “cash” cow. Then finally, the product will reach the “decline” stage, when the product is no longer attracting consumers’ interest or does not fulfill the consumers’ needs. Table 4 lists a few sports products provided by the authors that illustrate their current stage in the product life cycle.
Table 4. Examples of Various Sports Products at Different Life Cycle
| Stage | Products |
| Introduction | Bossball (https://www.youtube.com/watch?v=CFB_RCewa3s), Virtual reality goggle, Web/Internet TV |
| Growth | Fantasy sport games for many professional leagues, sports video games, Cross Fit, American Ninja Warrior competition |
| Maturity | UFC and Mixed Martial Arts, NASCAR |
| Decline | VHS sport tapes, And 1 basketball tour |
There is no prescribed length for each stage of PLC. Each PLC has its unique shape and length depending on the nature of the marketing environment. There are three other popular PLC forms that characterize the sustainability of certain sports products.
(1) The fad PLC is characterized by quick sales and acceptance of the product followed by decline state (e.g., XFL in late 90s).
(2) The classic PLC shows the continuous stage of maturity (e.g., NFL and College Football).
(3) The seasonal PLC perfectly illustrates the sales of sports products rise and fall with the opening and closing of the season (e.g., the major four tennis tournaments)
FYI: How do you feel about the future of these sporting events?
(1) NBA Slam Dunk contest
(2) Slam ball (https://www.youtube.com/watch?v=9PPuV7jK33k)
(3) National Lacrosse League
(4) AVL (Professional beach volleyball)
Is this the era for Web TV?? –Lieberman, D. (2009, Nov. 13-15). USA Today, A1 & A2
Major competitors (manufacturers) of this product include Sony, Samsung, LG, Panasonics, and Vizio. In 2009, 6 million televisions were sold (14% growth). In 2014, there were 45 million televisions sold with a 69% growth rate. Many experts try to predict how this new product will impact the existing cable television business. Perhaps, the direction of Yahoo’s role and its operating policies will dictate how widgets look, since the gigantic company may have much to lose.
(Q7) With any new sport product, sales are usually slow at first, but with the onset of the _____ stage, sales will start to increase.
- (a) maturity
- (b) growth
- (c) expansion
- (d) introduction
- (e) decline
(Q8) When a sports product starts the _____ stage, marketing goals must be made with regard to what to do with a failing product.
(a) growth
(b) maturity
(c) introduction
(d) decline
(e) expansion
New Product Development Process
When new sports products are introduced to the market, we can examine the development of these products through the perspective of the consumers or the organizations. The major foci of these perspectives will address topics such as, continuity of innovations, improvements, and repositioning. In general, the sports organizations often use the systematic approach, called new product development process to monitor and improve the products. This process covers six specific phrases:
- (1) Idea generation: This initial phrase considers the collection of all new ideas for creating a product.
- (2) Screening: The organization will evaluate how the collected ideas meet the organizations’ goals and consumers’ demands. The key elements of the screening list must address general characteristics of new product/service, profit potential, existing and potential competition, size of overall market, level of investment, and level of risk.
- (3) Business analysis/Concept testing: The organization will analyze the new products’ relative advantage, compatibility and potential risks. In addition, consumers’ interest and reaction are interviewed and studied.
- (4) Developing: The organization will introduce the new design and identify target markets.
- (5) Test marketing: The organization introduced a new product or service in one or more geographic areas on a limited basis.
- (6) Commercialization: This final stage concentrates on how to launch full-scale production and distribution. While managing the production of new products, the organization must be able to produce at competitive prices by utilizing appropriate labor and material resources.
(Q9) Product prototypes and marketing strategy can be evaluated in simulated or actual market situations through the use of _____.
- test marketing
- commercialization
- concept development
- concept testing
- both c and d
Diffusion of Innovations
Diffusion of innovations refers to the rate of new products spread through the marketplace. In general, the pace of diffusion is influenced by the characteristics of the product, consumers’ perceived newness of the innovation, and nature of the communication and advertisement (Shank & Lyberger, 2015). Researchers also pointed out different types of adopters that can be primarily found at a specific stage of product life cycle. When a new product (or service) is introduced, the “innovators” and “early adopters,” who usually have more discretionary income and time, will likely consume the product. The early majority group will purchase the product in the growth stage. When the product market becomes mature and stable, the “late majority” and “laggards” will finally join in as consumers. These different groups of adopters and the diffusion model can effectively illustrate how modern products such as HDTV, DVR, Tivo & broadband streaming have been introduced to the market.
The Product of Intercollegiate Athletics
The National Collegiate Athletic Association (NCAA) is a non-profit organization that governs the operations and implementation of the collegiate athletics. It is a member led organization dedicated to the well-being and lifelong success of its student athletes. It is comprised of 1,117 colleges or universities that are divided into three divisions (351 Division-1 schools, 308 Division-II schools, and 443 Division-III schools) and 100 athletic conferences.
Most of the revenues that NCAA brings in will go back into its member institutions (colleges and universities) to benefit the student-athletes. In 2017, the NCAA awarded $3.3 billion back into athletic scholarships and another estimated $150 million into supporting student-athletes in their academic pursuits. Much of the NCAA revenue comes from television and marketing rights fees. More than 85% of annual revenue is generated from the annual Division-I men’s basketball tournament (through agreements with CBS and Turner Network, or TNT). The NCAA has agreed to broadcast the tournament on CBS/TNT through the year 2032 (an eight-year contract extension of $8.8 billion). Its current TV contract with CBS/TNT ($10.8 billion) will end in 2024. The major corporate sponsors of the NCAA include Buffalo Wild Wings, Lowes, Buick, Reese’s, Indeed.com, Infiniti, The Marriott, Northwestern Mutual, and two more tournament sponsors Pizza Hut and Wendy’s. The licensed product sales and services also brought in $30.4 million for the NCAA last year.
Most scholars believe that the NCAA holds a monopolistic position and strength in college sports. Therefore, it will continue to enjoy its maturity phase in extended time and even periods of new growth. There are many other college sports entities such as NAIA, NCCAA, and NJCAA that provide programs and services. The NCAA by far is the most dominate market share holder in the college sports business. Even with its strong controlling status, the NCAA brand is not free from controversies and scandals. The league has been constantly attacked for being over commercialized and neglecting student-athlete’s academic priorities and well-being. The recent FBI probes on recruiting violation, academic frauds committed by many reputable instructions’ basketball programs (i.e., North Carolina, University of Connecticut or UConn, and Syracuse), exploitation of student-athlete’s time contribution and effort, and other legal issues all somewhat tarnish the league’s image. From the perspective of event attendance, the attendance for regular season football games and numerous bowl games also show a sign of decline (particularly in student attendance). All these issues may suggest that there is a need to revamp the existing programs and services or even reposition the brand in the consumers’ mind.
According to the authors’ own research, at a typical NCAA-affiliated mid-sized institution (with an enrollment between 9,000~15,000), football and men’s basketball usually have the highest number of average attendances. At a large flagship state institution, the average attendance of those two sports are significantly greater than any other sports on campus. Therefore, they are often viewed as the “revenue generating sports.” Women’s basketball at certain powerful programs such as Tennessee, UConn and Notre Dame may reach over 10,000. For most of the mid-sized schools, the average attendance of women’s basketball is usually quite similar to the women’s volleyball. Instead of having a lot of national or regional corporate sponsors on board, the schools usually have more local business including car dealerships, insurance agencies, local banks, realtors, restaurants, grocery shops, or gasoline stands as main sponsors (Chen & Street, 2015) (See Table 5 and 6).
Table 5. Examples of Official Sponsors of MSU Athletics
| Whitaker Bank, Kentucky Bank, Citizen Bank, Commercial Bank, US Bank, Comfort Suite Inn, MSU Bookstore, Life Care Center, Cracker Barrel, Pepsi, Perimeter Periodontics, Trademark Insurance, Free Enterprise System, Beacon Orthopedics, Penn Station, Wendy’s, Gattis’ Pizza, Papa John’s Pizza, Buffalo Wild Wings, DQ, Fazoli’s Restaurant, Jimmy John’s, Larry Fannin’s Chevrolets, Tim Short Auto, Liberty Mutual, KY Lotto, Hotthead Hair Salon, St. Claire Medical Center, Booth Energy, Shaltowee Trails |
Table 6. Examples of Official Sponsors’ Donations
| Company | Donation | Company | Donation |
| LaFinca | $250-500 | Phil Simms | $100-499G |
| Perimeter Periodontics | $10,00-2,500 | Larry Fannin | $50,000 |
| Halbrook Embroidery | $250-500 | Major Brand | $10000-50000 |
| Steve Hamilton | $250-500 | Liberty Mutual | $1000-2500 |
| Northcutt & Sons | $750-1000 | Pack’s Inc. | $50-100G |
| Premiere Periodon. | $1000-2500 | Larry Fannin | $50000 |
| Steven Barker | $5,000 | Packs Inc. | $50,000-100,000 |
(Q10) The majority of the NCAA revenue come from ticket sales of all athletic events. True or False
FYI: The fever of March Madness
The 2019 NCAA Men’s Basketball Tournament is projected to generate an audience approaching 100 million people watching on television from 180 countries and 700,000 to 800,000 attending live games (Krattenmaker, 2019). The NAA will make about $900 million from commercials, ticket sales, and corporate sponsorships and other sources. The betting wagers for the tournament is estimated to exceed $10 billion (much of it is illegal).
| FYI: Back to the Future—Retro Marketing
A popular method to make your college game night packed and electrified is to draw in the spectacular retro night. Welcome your former XXXX Conference Championship Team for the reunion!! Focus on these five practical areas to implement the retro marketing plan: Imagery, Merchandising, Venue, Game-day Promotions, and Advertising (Scola, 2018). |
Brainstorming Activities
Identify a sports product/service that is considered rising or declining. Suggest a few ways to extend its product life. What can be changed and added to improve the existing product or service?
You may also take a look at the article below and share your thoughts about UnderArmour’s decision for entering the lifestyle apparel products.
(http://adage.com/article/cmo-strategy/armour-s-marketing-dilemma/309982/)
Inter Sport: www.Intersport.com
AdReady: A division of CPXI http://site.adready.com
SP Gameday: http://www.spplus.com/Gameday
Crowdtorch: www.crowdtourch.com
Access Pass and Design: www.accesseventsolutions.com
References
Chen, S., & Street, E. (2015, November). The price tag of a regional university’s athletic sponsorship deal. Paper presented at the 2015 KAHPERD Annual Convention, Lexington, KY.
Collignon, H., Sultan, N., & Santander, C. (2011). The sports market: Major trends and challenges in an industry full of passion. http://www.atkearney.com/documents/10192/6f46b880f8d1-4909-9960-cc605bb1ff34
Cuneen, J. (2009). Trends in sport marketing and future research: Loyalty beyond reason. A paper presented at the 2009 Sport Marketing Association Annual Conference, Cleveland, OH.
Dees, W., Walsh, P., McEvoy, C., McKelvey, S., Mullin, B.J., Hardy, S., & Sutton, W.A. (2022) (2014). Sport marketing (5th ed.). Champaign, IL: Human Kinetics.
Eschenfelder, M. J., & Li, M. (2007). Economics of sport (2nd ed.). Morgantown, WV: Fitness Information Technology.
Fullerton, S. (2022). Sport marketing (4th ed.). Chicago, Illinois: Chicago Business Press.
Fry, A. (2002). Sports marketing: Beyond branding. Haymarket Business Publications. Retrieved from https://www.campaignlive.co.uk/article/sports-marketing-beyond-branding-sports-marketing-complicated-putting-logo-shirt-andy-fry-takes-look-ways-brands-work-sport/142389
Greenhalgh, G., Dwyer, B., & Biggio, B. (2014). There’s an app for that: The development of an NFL team mobile. Journal of Applied Sport Management, 6(4), 51-73.
Himmelberg, M. (1999). The sporting life: long hours, low pay, starting at the bottom. What fun! Orange County Register.
Kolah, A. (2005). Maximizing revenue from licensing and merchandising. London, United Kingdom: SportBusiness Group.
Krattenmaker, T. (2019). College debt is the real March Madness. USA Today. https://www.usatoday.com/story/opinion/2019/03/18/march-madness-ncaa-revenues-student-debt-wrong-priorities-column/3165524002/
Kwon, H., & Tail, G. (2001). Sport fan motivation: A comparison of American students and international students. Sport Marketing Quarterly, 10(2), 147-155.
Lombardo, J. (2014, March 3). Kings’ new sales tool: Gaming headset. Street and Smith’s SportsBusiness Journal, 16(44), 3
Maslow, A. H. (1970). Motivation and personality (2nd ed.). New York: Harper and Row.
Michaels, M. (2018). The price of a 30-second Super Bowl ad has exploded — but it may be worth it for companies. http://www.businessinsider.com/super-bowl-commercials-cost-more-than-eagles-quarterback-earns-2018-1
NASSM (n.d.). Sport management programs: United States. https://www.nassm.org/Programs/AcademicPrograms/United_States
Pasquarelli, A., & Pasquarelli, A. (2017). Spread too thin: Under Armour’s marketing dilemma. http://adage.com/article/cmo-strategy/armour-s-marketing-dilemma/309982/
Pitts, B., & Stotlar, D. K. (2013). Fundamentals of sport marketing (4th ed.). Morgantown, WV: Fitness Information Technology.
Plunkett, J. W. (2010). Plunkett’s sports industry almanac 2011. Houston, TX: Plunkett Research.
Price, C. (2017). Licensing–trademark licensing. https://rolltide.com/sports/2016/6/10/licensing-index-html.aspx
Rao, J. (2011). The Super Bowl as economic game changer.
http://cnbc.com/id/41044141/The_Super_Bowl as Economic Game Changer.
Robinson, M. J., & Miller, J. J. (2003). Assessing the impact of Bobby Knight on the brand equity of the Texas Tech basketball program. Sport Marketing Quarterly, 12(1), 56-59.
Sawyer, T. H., & Hypes, J. A. (2012). Marketing principles. In T. Sawyer & L. Judge (Eds.). The management of fitness, physical activity, recreation, and sport (pp. 397-409). Campaign, IL: Sagamore Publishing.
Scola, Z. (2018) “A conceptual framework for retro marketing in sport. Sport Marketing Quarterly, 27(3), 197–210. DOI:132750601.
Schwarz, E. C., & Hunter, J. D. (2008). Advanced theory and practice in sport marketing. Burlington, MA: Butterworth-Heinemann.
Shank, M. D., & Lyberger, M. R. (2015). Sports marketing: A strategic perspective (5th ed.). New York, NY: Routledge.
Williams, B. (2015). The unique sports marketing challenges facing Minor League Baseball. https://www.forbes.com/sites/blakewilliams3012/2015/08/11/the-unique-sports-marketing-challenges-facing-minor-league-baseball/#4dafa8a59353
Zhang, J., Smith, D., Pease, D., & Jambor, E. (1997). Negative influence of market competitor on the attendance of professional sport games: The case of a minor league hockey team. Sport Marketing Quarterly,
.
