The components of a skeletal muscle cell include peripheral nuclei, mitochondrion, myofibrils, and alternating light and dark bands. Striations are visible due to the alignment of actin and myosin proteins as arranged in sarcomeres in series.
Learning Objectives
Identify and describe the three types of muscle tissue: skeletal, smooth, and cardiac.
Describe the structure and function of muscle fibers, including the roles of the plasmalemma, sarcolemma, and satellite cells.
Explain the differences between type I (slow-twitch) and type II (fast-twitch) muscle fibers, including their metabolic properties and roles in different types of physical activities.
Explain the sliding filament theory and the process of muscle contraction cycling.
Describe the role of ATP in muscle contraction and relaxation.
Understand the sequence of events in excitation-contraction coupling and the role of calcium in muscle contraction.
Define and differentiate between isotonic, isometric, and isokinetic muscle actions.
Understand the force-velocity relationship and its implications for muscle performance.
Explain the power-velocity relationship and identify the optimal speed of movement for maximizing power output.
Introduction to Muscle Physiology
In the preceding chapters, we established a foundational understanding of metabolism and the basic research concepts of energy expenditure. This groundwork is essential for delving into the structure and function of exercising muscle, which is the cornerstone of human movement and a primary focus of research for exercise physiologists. The upcoming sections will explore how the structure and function of exercising muscle and muscle fibers are crucial for comprehending sport performance and maintaining general health. Given the pivotal role of skeletal muscles in sports performance, a comprehensive understanding of muscle physiology is indispensable not only for exercise scientists but also for physical educators, physical therapists, and coaches.
As previously noted, there is significant overlap between organ systems, as they rely on each other to achieve homeostasis, ensure optimal system function, and maintain overall health. Chapter 7 examined the nervous system and its role in initiating and transmitting signals for the activation of skeletal muscle, covering the first three processes in the pathway of force production. With the nervous system responsible for initiating skeletal muscle excitation, this chapter will focus on the final process in the pathway: muscle contraction cycling.
Structure and Function of Exercising Muscle
The muscular system encompasses a variety of functions carried out by three distinct types of muscles: skeletal muscle, smooth muscle, and cardiac muscle (refer to Figure 8.1). Smooth muscle, often referred to as involuntary muscle, operates without direct conscious control. It is located around the walls of luminal areas (i.e., openings in the body), enabling these openings to dilate or constrict. For instance, smooth muscle encircles the walls of blood vessels, regulating blood flow by either dilating or constricting the vessels. Additionally, smooth muscle is present in the walls of most organs, where it facilitates the movement of food through the digestive tract, the expulsion of urine, and the process of childbirth.
Figure 8.1, Illustrations of the three types of muscle. 1) Skeletal muscle cells are striated (3) and exist as long tubular cells. Skeletal muscles are multi-nucleated (4) and the nuclei are embedded in the cell membrane (5). 2) Smooth muscles are spindle shaped (6), and each cell has a single nucleus (7). There are no striations as in skeletal muscle. 3) Cardiac muscle cells function to pump blood, which is an involuntary action. Unlike skeletal muscles, cardiac muscle cells branch off from each other to allow uniform transmission of depolarization. Specialized junctions exist between adjacent branching cardiac cells (9). Cardiac cells are striated (8), and each cell has a single nucleus (10).
Cardiac muscle is exclusively found in the heart. It is striated like skeletal muscle but operates involuntarily. Essentially, cardiac muscle controls itself, with minor regulation by the nervous and endocrine systems. It features specialized junctions called intercalated discs, which allow electrical impulses to swiftly transfer throughout the heart. A more detailed discussion of cardiac muscle will be provided in Chapter 9.
Skeletal muscle, on the other hand, is under conscious control and is named because most of these muscles are attached to the skeleton. Together with the bones of the skeleton, they form the musculoskeletal system. Exercise requires body movement, which is accomplished through the action of the musculoskeletal system. Given that exercise and sport physiology depend on movement, this chapter will primarily focus on the structure and function of skeletal muscle. Despite the anatomical differences between these muscle types, their control mechanisms and principles of action are similar. Figure 8.1 illustrates the different types of muscle in the body and details the differences in their structures.
Gross Structure of Skeletal Muscle
The human body contains over 600 skeletal muscles, which constitute approximately 40% of a person’s body weight. Skeletal muscle plays a crucial role in regulating other organ systems. The general functions of skeletal muscles include:
Force generation for locomotion and breathing,
Force generation for postural support,
Heat production during cold and stress,
Acting as endocrine organs, as suggested by new evidence.
The most apparent function of skeletal muscle is force production, which is essential for breathing and locomotion. Skeletal muscles enable the movement of bony lever systems, transferring the forces generated within the body to external objects. These muscles are attached to bones by tendons, which are composed of fibrous cords of connective tissue that transmit the force generated by muscle fibers to the bones. One end of the muscle is attached to a bone that does not move, known as the origin of the muscle. The opposite end, called the insertion, is fixed to a bone that moves during contraction. Various types of movements are possible, depending on the type of joint and the muscles involved. Muscles that decrease the angle of a joint are called flexors, while those that increase joint angles are called extensors.
Figure 8.2 The basic structure of skeletal muscle and the connective tissue layers associated within.
Skeletal muscle is composed of various tissues, including muscle fibers, nervous tissue, blood vessels, and different types of connective tissue. Figure 8.2 illustrates the anatomical compartments of skeletal muscle, which are delineated by layers of connective tissues. Individual muscles are separated and held together by a connective tissue called the fascia. Beneath the fascia, the most superficial layer of connective tissue surrounding the muscle belly is known as the epimysium. Skeletal muscle is further divided into bundles of fibers, each wrapped in a connective tissue sheath. These bundles, calledfasciculi (or fascicles), are encased in a connective tissue layer called the perimysium. Within each bundle, individual muscle fibers (cells) are enveloped by a connective tissue sheet known as the endomysium. Due to this compartmentalization, the longest human muscle fibers measure approximately 12 cm (4.7 in.) and contain about 500,000 sarcomeres, the fundamental units of muscle contraction[1].
Muscle Fibers
A single muscle cell, referred to as a muscle fiber, can vary in diameter from 10 to 120 μm, making it nearly invisible to the naked eye. Like all other cells in the body, skeletal muscle fibers are surrounded by a plasma membrane called the plasmalemma. The plasmalemma is part of a larger structure known as the sarcolemma (see Figure 8.3). The sarcolemma consists of both the plasmalemma and a basement membrane. The plasmalemma plays a crucial role in maintaining acid-base balance and facilitating the transport of metabolites from the capillary blood into the muscle fiber.
Figure 8.3 The structure of a single muscle fiber.
Between the plasmalemma and the basement membrane resides an important structure for the regeneration and repair of skeletal muscles called the satellite cell. Satellite cells play a major role in hypertrophy as well as repair after trauma due to exercise training, immobilization, or injury[2]. These cells, also known as “myogenic stem cells,” typically lie dormant. When activated, satellite cells divide and contribute their nuclei to existing fibers, thereby increasing the capacity to synthesize new contractile proteins. Each satellite cell is responsible for a particular domain of the muscle cell. Satellite cells also facilitate muscle hypertrophy by donating extra nuclei to muscle fibers.
Sarcoplasm
A fluid portion of the cell fills the spaces between structures and organelles and is called the sarcoplasm—its cytoplasm. Inside the sarcolemma, a muscle fiber contains smaller subunits called myofibrils, the contractile units of the cell, which are described later. The sarcoplasm also contains proteins, minerals, glycogen, and fats. The sarcoplasm differs from the cytoplasm because it contains large amounts of stored glycogen and myoglobin, an oxygen-binding protein that transports oxygen in the muscle cell[3].
Figure 8.4 The muscle triad is made of a T-tubule surrounded by terminal cisternae on each side. Together, these three structures make up the triad.
The sarcoplasm also houses an extensive network of transverse tubules (T-tubules), which are extensions of the sarcolemma that pass laterally through the muscle fiber. The T-tubules allow nerve impulses received by the sarcolemma to be transmitted to individual myofibrils. The T-tubules also provide a pathway for extracellular substances to enter the cell and a path for waste products to leave the cell. Surrounding the T-tubules are enlarged portions of the sarcoplasmic reticulum (SR) called the terminal cisternae. Figure 8.4 depicts the sarcoplasmic reticulum, which is a longitudinal network of tubules that run parallel and loop around the myofibrils. Calcium is stored in the sarcoplasmic reticulum and terminal cisternae, which is essential for muscle contraction. Often, the structure made by a T-tubule surrounded by terminal cisternae on each side is called the muscle triad and is located at the A-I junction (see the Sarcomere section for explanation).
Myofibrils
Figure 8.5 A micrograph of striated skeletal muscle from the right fibularis longus. A hematoxylin phloxine saffron stain was used to make the structures visible to the naked eye.
Each muscle fiber is composed of several hundred to several thousand myofibrils. Myofibrils are threadlike strands within muscle fibers and make up the basic contractile elements of skeletal muscle. Each myofibril is composed of numerous sarcomeres joined end to end by a structure called the Z-disk. Sarcomeres give skeletal muscles a striated appearance under a microscope (Figure 8.5).
Sarcomeres
Asarcomere is the basic unit of muscle contraction that is separated from other sarcomeres by Z-disks. Each sarcomere contains the following zones:
The I-band (isotropic: light zone)
The A-band (anisotropic: dark zone)
The H-zone (in the middle of the sarcomere)
The M-line (in the middle of the H-zone)
There are two major proteins responsible for muscle contraction, differentiated into thin and thick filaments. The thinner filaments are composed primarily of actin, and the thicker filaments are primarily myosin. Striations in skeletal muscle result from light passing through these alignments of proteins in the sarcomere, as illustrated in Figure 8.6. The light I-band indicates the region of the sarcomere where there are only thin filaments, allowing more light to pass through the tissue under a microscope. Thus, this area of the sarcomere was named the I-band for isotropic. The darker A-band (anisotropic) represents the regions of the sarcomere that contain both thick and thin filaments, allowing less light to pass through and giving it a darker appearance. The H-zone is the central portion of the A-band and does not contain thick filaments, as myosin does not extend the full length of a sarcomere. The H-zone appears lighter under a microscope and was named for the German word for brighter, heller. The M-line resides in the center of the H-zone and is composed of proteins important for structure that will be described later.
Figure 8.6 The microstructure of a muscle. A skeletal muscle contains numerous myofibrils, each consisting of units called sarcomeres. Each sarcomere is separated by Z-discs and contains an A-band, I-band, H-zone, and M-line.
Myosin is the principal protein of the thick filament and is an ATP-dependent motor protein. Each myosin filament (15 nm) is formed by about 200 myosin molecules that are twisted together in two strands. One end of the strand is folded into a globular structure, called the myosin head (Figure 8.7). Many of these heads protrude from the thick filament to form cross-bridges that interact with sites on actin. When energized by ATP, myosin heads can rotate on a hinge to move actin filaments toward the center of the sarcomere. Fine filaments composed of the “giant” protein titin (also called connectin) extend from the Z-disk to myosin, stabilizing myosin filaments along their longitudinal axis.
Figure 8.7 Actin (thin filament) and myosin (thick filament) proteins allow association of the filaments to produce force.
Another recently discovered giant protein named nebulin (originally called band 3) may also be involved in keeping the thin filaments centered during force generation. Nebulin is thought to play a regulatory role in mediating actin and myosin interactions and is often referred to as an “anchoring protein” because it provides a framework that helps stabilize the position of actin. Together, titin and nebulin are thought to be involved in the passive elasticity of the muscle fiber and provide axial continuity for the production of resting tension[4].
The thin filament of the sarcomere is primarily composed of actin (6 nm), but also includes two other protein molecules called tropomyosin and troponin. Individual subunits of actin are called G-actin and are globular proteins. G-actin subunits are joined together to form two strands of actin microfilaments, which are twisted into a helical pattern. Actin microfilaments are present in all cells and are central to conserving cell structure. Tropomyosin is a tube-shaped protein that twists around the actin strands and functions to cover actin binding sites. Troponin is attached at regular intervals to both the actin strand and the tropomyosin[5]. Tropomyosin and troponin work together to maintain relaxation or contraction (if calcium is present) of the myofibril.
Figure 8.8 demonstrates the specialized arrangement of actin and myosin filaments and associated proteins. The M-band proteins myomesin and C-protein crosslink the myosin filaments in the sarcomere. Myomesin is found in the M-line and associates with M-protein. Myomesin is found in both slow and fast fibers, whereas M-protein is found only in fast fibers. Desmin is another protein that is thought to be important for sarcomere architecture. Desmin is an intermediate filament (8-10 nm) that forms a three-dimensional scaffold around the Z-disc[6]. These proteins are thought to be involved in anchoring myosin to other filaments[7].
Figure 8.8 The sarcomere contains a specialized arrangement of actin and myosin filaments. Associated proteins important for structure and function of the sarcomere are also illustrated.
Muscle Fiber Types
Not all muscle fibers are alike. A single skeletal muscle contains muscle fibers that differ in key characteristics. These characteristics can include different speeds of shortening velocity, different isoforms of myosin ATPase (i.e., the enzyme for breaking down ATP), and different α-motor neuron innervation. These characteristics affect the muscle fibers’ ability to generate maximal force.
Type I (also called slow-twitch) fibers take approximately 110 ms to reach peak tension. They are the smallest of the fibers and predominantly use aerobic metabolism to generate ATP. Type II muscle fibers (also called fast-twitch), on the other hand, are larger in size and can reach peak tension in about 50 ms[8]. Only one form of type I fiber has been identified; however, there are two major forms of type II fibers, type x (type IIx) and type a (type IIa). Type IIx fibers are equivalent to type IIb in animals and are the largest fibers in humans. Type IIx fibers utilize mainly aerobic metabolism to generate ATP. Type IIa fibers are still considered to be large and use a combination of anaerobic and aerobic metabolism. A third subtype of fast-twitch fiber has also been identified, type IIc, but the differences among the type II fibers are not fully understood. Table 8.1 describes various metabolic, anatomical, and physiological characteristics of human skeletal muscle fiber types.
Table 8.1 Characteristics of human skeletal muscle fiber types.
Characteristic
Type I
Type IIa
Type IIx
Fibers per motor neuron
≤ 300
≥ 300
≥ 300
α-Motor neuron size
Small
Large
Large
Contractile speed
Slow
Fast
Fast
Type of myosin ATPase
Slow
Fast
Fast
Predominant energy system
Aerobic
Combination
Anaerobic
Oxidative capacity
High
Moderately high
Low
Glycolytic capacity
Low
High
Highest
Fatigue resistance
High
Moderate
Low
Fiber size
Small
Large
Large
Myoglobin content
High
Low
Low
As you may recall, the size principle describes the orderly and sequential recruitment of motor units from smallest to largest. According to the size principle, type I fibers are recruited the most often and are first to be recruited in the progression. Motor unit recruitment depends heavily on the force or resistance of the exercise. With light intensity exercise, the type I (small) motor units are recruited. When the resistance or load is increased, the type IIa (large) motor units will be recruited with the help of the type I fibers. If the load becomes even greater, the type IIx (largest) fibers will be recruited with the help of type IIa and type I motor units. With additional motor units recruited, the force exerted by each unit is increased, and they exhibit a higher rate of firing due to increases in the impulse firing from the nervous system (called rate coding). As the velocity of any movement increases, the size principle is retained; however, the order is less pronounced.
Most skeletal muscles contain both type I and type II fibers, as depicted in Figure 8.8. On average, most muscles are composed of roughly 50% type I fibers, 25% type IIa fibers, and 25% type IIx fibers (type IIc fibers only make up 1-3%). Because knowledge about type IIc fibers is limited, we will not discuss them further. Generally, arm and leg muscles have similar fiber compositions within an individual. This has been shown in the hip flexors (e.g., gluteus maximus and hamstrings), gastrocnemius, knee extensors (e.g., vastus lateralis), shoulders, and the latissimus dorsi. There are exceptions; however, the soleus muscle has a greater tendency to have a higher percentage of type I fibers in everyone[9]. The rectus femoris, biceps, triceps, and pectoral muscle groups have a greater tendency towards type II proportions [6].
Figure 8.8 Immunohistochemical staining can identify differences in muscle fiber types as illustrated in a cross-sectional area of a skeletal muscle. The blue cells represent type I fibers, whereas the green cells represent type IIa fibers.
Characteristics of fiber types are genetically determined and appear to be established within the first few years of life. This means that the genes we inherit from our parents determine which α-motor neurons innervate our individual muscle fibers. After innervation is established, muscle fibers differentiate. Some recent evidence, however, suggests that endurance training, strength training, and muscular inactivity may cause a shift in the myosin isoforms. Training may induce a small change, less than 10%, in the percentage of type I and type II fibers. Both endurance and resistance training have been shown to reduce the percentage of type IIx fibers while increasing the fraction of type IIa fibers. Specifically, training can result in a shift from type IIx to IIa, in which the fibers will have more oxidative properties. Aging may also alter the distribution of type I and type II fibers. It is known that as we grow older, muscles tend to lose type II motor units, which increases the percentage of type I fibers.
Numerous studies have investigated muscle fiber types’ role in successful performance in athletes. As mentioned previously, the general population, sedentary individuals, and non-athletes typically have a 50/50 mix of type I to type II muscle fibers. It has been shown that highly successful power athletes (track sprinters) typically possess a high percentage of type II fibers (70-75%) and a lower percentage of type I fibers (25-30%)[10]. On the other hand, highly trained distance runners have been shown to possess a high percentage of type I fibers (70-80%) and a lower percentage of type II fibers (20-30%)[11]. Lastly, there are no apparent sex or age differences in fiber distribution[12]. Nevertheless, considerable variation exists in the percentage of various fiber types even among successful athletes competing in the same event or sport. This demonstrates that an individual’s muscle fiber composition is not the only variable that determines success in athletic events[13]. Success in athletic performance is due to many complex interactions, including but not limited to psychological, biomechanical, and cardiopulmonary factors.
Muscle Contraction
The study of muscle contraction has a long history that has changed rapidly as the original theories of how force is produced have been rejected due to advancements in science. Andrew F. Huxley is credited for developing the sliding filament theory. The sliding filament theory explains the phenomenon of the shortening of muscle cells when the myosin cross-bridges are activated. Huxley’s original model for muscle contraction was proposed in 1957 but has since been modified[14][15].
We now know that muscle contraction occurs as a cycle. This cycle is referred to as muscle contraction cyclingand is the last process in the pathway of force production. Force production occurs during a step in the process called the “power stroke,” which will be detailed in the following section.
Excitation-Contraction Coupling
Figure 8.9 Excitation-contraction coupling. Arrival of the action potential at the neuromuscular junction causes excitation of the muscle cell. When activated the sarcoplasmic reticulum releases calcium into the sarcoplasm which reacts with troponin. The reaction allows a thick and thin filament interaction known as a cross-bridge. Cross-bridge formation leads to a muscle contraction, thus shortening of the muscle and creation of tensions.
The complex sequence of events that triggers a muscle contraction is termed excitation-contraction coupling because it begins with excitation of an α-motor neuron and results in muscle contraction. Excitation begins at the neuromuscular junction (NMJ) when the motor endplate of the muscle is excited by the arrival of an action potential. As the motor endplate is excited, the depolarization travels down the T-tubules to the sarcoplasmic reticulum. The details of the neural processes were discussed more fully in Chapter 7. A summary of events that lead to tension production by muscle is illustrated in Figure 8.9.
Muscle Contraction Cycling
In the pathway of force production, skeletal muscle plays the mechanical role in which force or tension is produced by the muscles. The process is called muscle contraction cycling, sometimes also called cross-bridge cycling. The energy for muscular contraction comes from the breakdown of ATP by the enzyme myosin ATPase. A single contraction cycle or “power stroke” of all the cross-bridges only shortens the muscle by 1% of its resting length. Because of this, it is clear that the contraction cycle must be repeated over and over again as some muscles can shorten up to 60% of their resting length.
Muscle contraction cycling is activated when an action potential impulse is received by the neuromuscular junction. The impulse then travels down the T-tubules and into the sarcoplasmic reticulum. Calcium is released from the sarcoplasmic reticulum (i.e., the terminal cisternae) into the cytoplasm of the cells and binds to troponin. This is the “trigger” step in the control of muscle contraction cycling because troponin and tropomyosin control the interaction of actin and myosin (Figure 8.10).
Figure 8.10 Muscle contraction cycling. (a) Calcium released from the SR binds to troponin shifting tropomyosin away from the actin binding sites. Concurrently, ATP binds to the myosin head and is hydrolyzed to ADP and Pi. (b) The myosin head binds to actin creating a cross-bridge. (c) The myosin head pulls on the actin filament which produces force. This is known as the power stroke. (d) A second ATP attaches to myosin and the myosin head detaches. (e) A new ATP binds to the myosin head, cocking it into the high energy, extended position. If the ATP and calcium concentration are maintained, the cycle will revert back to (a). Relaxation occurs when the action potentials are not received by the neuromuscular junction and calcium is actively pumped back into the SR.
The thin filament is composed of actin myofilaments, troponin, and tropomyosin proteins that are arranged in a fashion where tropomyosin can be shifted to reveal myosin binding sites.
Calcium release causes troponin to shift, pulling tropomyosin away from the active site on actin. Concurrently, the myosin head on the thick filament is being energized. This occurs when an ATP molecule binds to myosin and is hydrolyzed by ATPase, releasing energy. This activates the myosin head, cocking it into the high-energy, extended position.
Figure 8.11 When a skeletal muscle contracts individual sarcomeres shorten as thick and thin filaments slide past one another. Shortening of the sarcomere as illustrated by arrows results in a concentric muscle action.
When the active site on actin is exposed, it permits the energized myosin head to bind, creating a cross-bridge. Cross-bridge formation is ultimately the most important variable in force generation and tension development by muscles. The cross-bridge binding initiates the release of energy stored within the myosin molecule; this causes the myosin head to pull on the actin filament and slide actin along myosin. This is also known as the “power stroke” and is the step where force is produced. The power stroke results in muscle shortening (Figure 8.11).
A fresh ATP then arrives and attaches to the cross-bridge; it is needed to release the bond between actin and myosin. The enzyme ATPase again hydrolyzes the ATP attached to the myosin cross-bridge and provides the energy necessary for re-attachment to another active site on actin. If the active site on actin is aligned with the myosin head, then the cycle will continue to repeat. Muscle contraction cycling will then be repeated as long as ATP is available, calcium concentrations are maintained, and action potentials are received by the NMJ.
Muscle Relaxation
Figure 8.12 Muscle relaxation.
If the cell is no longer activated, everything will return to the resting state (Figure 8.12). Relaxation of the muscle fiber occurs when action potentials are no longer received by the NMJ. When this happens, calcium is actively pumped back into the sarcoplasmic reticulum, which requires ATP. The removal of calcium from troponin causes tropomyosin to move back to cover the binding sites on actin, blocking the cross-bridge binding site on actin. This action results in the relaxation of the muscle fiber.
Types of Muscle Action
The process of skeletal muscle force generation is referred to as “muscle contraction”; however, this terminology suggests that a muscle is always shortening, although muscle is also capable of lengthening or staying the same length while generating force. For this reason, the term muscle action has been proposed to describe muscle force production. There are three major types of muscle actions: isotonic, isometric, and isokinetic actions, which will be described in this section.
Most types of exercise or sport activities require muscle actions that result in dynamic movement of limbs. In the context of a sport movement, muscles will undergo isotonic muscle action (dynamic), where there is a change in muscle length to enable movement. There are two isotonic muscle actions: concentric and eccentric. An isotonic muscle action that results in the shortening of a muscle is called a concentric action. Figure 8.13A shows an example of a biceps curl in which the upward movement of the exercise results in concentric action. In contrast, if the muscle action results in the lengthening of a muscle while activated and actively producing force, this is called an eccentric action. Eccentric action occurs when the force generated is insufficient to overcome an external load on the muscle, and the muscle fibers lengthen as they produce force. Eccentric actions are also used as a means of decelerating a body part or object, such as lowering a dumbbell during a biceps curl (Figure 8.13B) or lowering grocery bags to the floor.
Figure 8.13 A) Concentric muscle action occurs when a muscle shortens, B) Eccentric muscle action occurs when a muscle exerts force bot lengthens, and 3) Isometric muscle action occur when a muscle exerts force but does not shorten.
Isometric actions (static) occur when a muscle is generating force but is not changing lengths. An example of isometric actions is what happens when a person holds a dumbbell without moving it, with their elbow flexed at 90° in front of their body, for a period of time (Figure 8.13C). This action is considered to be a static exercise because the dumbbell does not move, and therefore neither does the body part that applies the force. Isometric actions are also common in postural muscles of the body during periods of standing or sitting.
The last muscle action that will be mentioned is an isokinetic action (same speed). This is a muscle action completed at a constant velocity of movement, or speed. They are similar to isotonic in that the muscle changes length during contraction. Isokinetic actions are studied but not commonly found in sport or exercise because they require specialized equipment to achieve. Isokinetic contractions require a machine called an Isokinetic Dynamometer, which is expensive and bulky. Since this equipment is not practical from the standpoint of transferring the movement to sport or exercise, this muscle action is only used in research settings.
Generation of Force
The amount of force generated by a single muscle fiber is unquestionably related to the number of myosin cross-bridges making contact with actin. If a muscle fiber is given a single stimulus, the muscle will respond with a simple twitch. However, force exerted by a group of muscles is complex and can be affected by more than one factor. The three primary factors are:
The number and types of motor units recruited,
The length of the muscle when stimulation ensues,
The frequency and nature of the neural stimulation of the motor units.
There are variations in the force production capabilities of different muscle fibers. Recall that muscle fibers are recruited based on the size principle and that the larger motor units are recruited last. Fast fibers exert a greater specific force than slow fibers. Therefore, the types of motor units recruited influence force production. Recruitment of larger motor units results in increases in force production. Additionally, the number of muscle fibers increases as the stimulation increases. As the stimulation increases, the force of contraction also increases due to the recruitment of additional motor units. Therefore, if more motor units are recruited, the force is increased.
The second factor that affects muscle force production is the initial length of the muscle. There exists an ideal length for force generation that is related to the overlap of actin and myosin (Figure 8.14). Production of myosin cross-bridges is necessary for the production of force. If the resting length is longer than optimal, an overlap between actin and myosin will limit cross-bridge attachment. Note that when a muscle is stretched to the point where there is no overlap between actin and myosin, no tension is developed. At the other extreme, when the muscle is shortened to about 60% of its resting length, the Z-lines will lie more closely to the A-band, which will also limit the muscle’s ability to shorten and produce additional tension.
Figure 8.14 The length-tension relationship in skeletal muscle. There is an optimal length of muscle which will produce maximal force when stimulated. Lengths longer or shorter than optimal result in a reduced amount of force when stimulated.
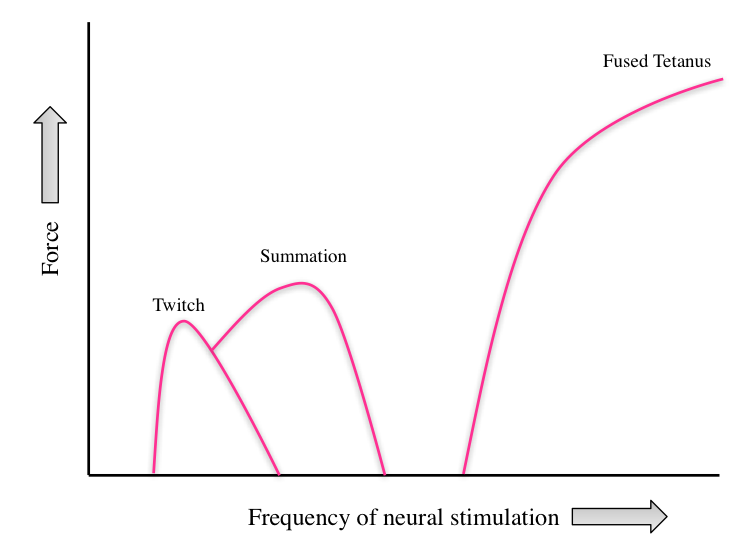
The nature of the neural stimulation can also affect the amount of force produced. Simple muscle twitches examined under experimental conditions reveal fundamental properties about how muscles function. This is useful; however, normal body movements involve sustained contractions that are not simple twitches. A simple twitch is a muscle contraction as a result of a single stimulus. If more than one stimulus is delivered to the muscle and the muscle does not have time to relax, the force produced is additive. The addition of successive twitches is called summation. If the frequency of stimuli is increased further, the single twitches blend together into a single, sustained contraction called tetanus. Increases in stimulation from the nervous system result in tetanus, where peak force production occurs. Figure 8.15 illustrates how the frequency of neural stimulation affects force production during experimental conditions.
Figure 8.15 A comparison of forces generated by a single twitch, summation of two twitches, and fused tetanus.
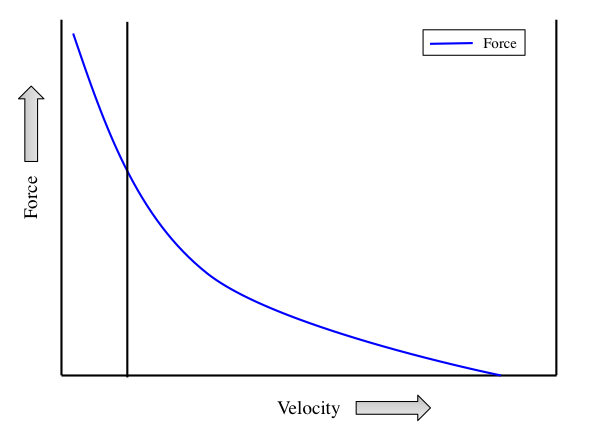
The Force-Velocity Relationship
In most physical activities, muscular force is applied throughout a range of motion to propel the body or transmit force through external objects. Since in many sporting events speed is a determinant of success, it is important to investigate the basic concepts behind the relationship between muscular force and the speed, or velocity, of movement.
As previously discussed, it is known that fast-twitch muscle fibers exert more force than slow-twitch muscle fibers. In this case, muscle groups that contain a high percentage of fast fibers will also have a greater speed of movement, at any force[16]. Physiologically, this may be explained by the fact that fast fibers possess higher ATPase activity than slow fibers do. Thus, ATP can be more rapidly hydrolyzed in fast fibers. It is also known that the neural stimulation to fast fibers is more quickly delivered. Further, this increases the potential for calcium release from the SR, resulting in more effective excitation-contraction coupling[17].
In practical application to performance, athletes who possess a high percentage of fast fibers would seem to have an advantage in power-type athletic events. This may explain why successful sprinters and weightlifters typically possess a relatively high percentage of fast fibers.
Figure 8.16 Muscle force-velocity relationship.
The force-velocity relationship, as depicted in Figure 8.16, demonstrates that the maximum velocity of muscle shortening occurs at the lowest force. This concept can be easily understood by comparing the lifting of a light load to a heavy load; the light load can be moved more quickly. Therefore, the highest speed of movement is achieved at the lowest workload, regardless of muscle fiber type. Conversely, the maximal velocity of shortening in a muscle fiber is greatest when the force, or resistance against the muscle, is minimal.
The force generated by a muscle is determined by the number of myosin cross-bridges that are attached. However, forming these cross-bridge connections requires time. During rapid muscle shortening, the actin and myosin filaments slide past each other at a faster rate, which limits the number of cross-bridges that can form and, consequently, reduces the muscle’s force capacity.
In summary, three key points emerge from examining the force-velocity relationship:
Fast-twitch muscle fibers exert the greatest forces at any given velocity.
The highest speed of movement is generated at the lowest workloads.
Rapid movements limit cross-bridge connections, thereby reducing force production.
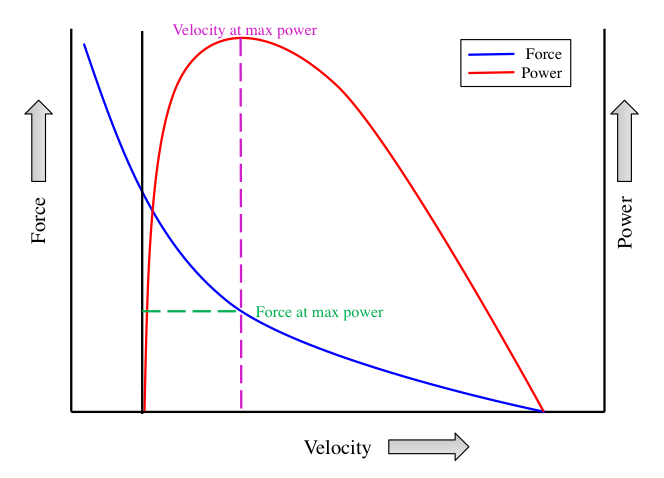
Power-Velocity Relationship
Power is defined as the performance of work over a unit of time, with peak power representing the highest power value achieved during a maximal test. Since power is a function of force, distance, and time, there are notable similarities between the force-velocity and power-velocity relationships. The fiber-type composition of a muscle significantly influences its ability to generate power. At any given velocity of movement, muscles with a high percentage of fast-twitch fibers produce greater peak power.
Figure 8.17 Muscle power-velocity relationship. Peak power increases with increasing velocities up to 200 to 300 degrees/second. There is a decline in power beyond this point.
The power-velocity curve, illustrated in Figure 8.17, shows how the velocity of movement influences power output up to a certain point. Similar to force generation, there is an optimal speed of movement that produces the highest power output. Peak power increases with rising velocities, reaching its maximum at approximately 200-300 degrees per second. Beyond this velocity, power output declines rapidly as the speed of movement continues to increase. This decline occurs because muscular force decreases with higher speeds. Consequently, for any given muscle group, there is an optimal speed of movement that maximizes peak power.
Chapter Summary
In this chapter, we examined the intricate structure and function of exercising muscle, emphasizing its pivotal role in human movement and overall health. A detailed examination of skeletal muscle revealed its complex composition, including muscle fibers, connective tissues, and the essential roles of the plasmalemma, sarcolemma, and satellite cells in muscle regeneration and repair.
The mechanisms of muscle contraction, from the sliding filament theory to the processes of excitation-contraction coupling and muscle contraction cycling were discussed. Understanding these mechanisms is crucial for comprehending how muscles generate force and produce movement. We also differentiated between isotonic, isometric, and isokinetic muscle actions, providing practical examples of each.
The chapter further explored the force-velocity and power-velocity relationships, illustrating how muscle fiber composition and movement speed influence force and power generation. These concepts are vital for understanding athletic performance and the physiological basis behind different types of physical activities. Finally, we examined how muscle fiber types and their distribution affect athletic performance, noting the impact of training and aging on muscle function. This comprehensive overview equips students with a solid foundation in muscle physiology, essential for careers in exercise science, physical education, physical therapy, and coaching.
Scholarly Questions
List the steps of muscle contraction cycling.
Pathway of Force Production: Name and describe the four stages of the pathway of force production. This is worth major points on the exam!
Define the following muscle actions: isotonic, isometric, and isokinetic.
Explain the changes in the H zone length during different muscle actions: Concentric action, Eccentric action, Isometric actions. Also, describe the changes in the I-band, A-band, and the distance between the Z-lines.
Identify the most superficial and the deepest layers of connective tissue surrounding the muscle body.
Which type of muscle action decreases the angle of a joint?
Define the following terms: myofibrils, sarcolemma, plasmalemma, sarcoplasm, T-tubules, muscle triad, sarcoplasmic reticulum, motor endplate, multinucleated, mitochondria, and sarcomere.
Explain the importance of satellite cells and their function.
Do muscle fibers with a greater percentage of type II fibers exert a faster or slower velocity of contraction?
Do muscle fibers with a greater percentage of type I fibers fatigue faster or slower?
What is the general percentage of fast-twitch to slow-twitch fiber types in weight lifters and non-athletes?
Discuss the factors that affect force production.
Define a muscle twitch and fused tetanus.
Describe the relationship between force production and the velocity of movement. At what speeds does muscle generate the greatest forces? Why does this happen? (Note: This was not discussed in lecture; please read on your own.)
What is the optimal velocity at which muscle generates the greatest peak power? (Note: This was not discussed in lecture; please read on your own.)
In class, we broke down the sites of peripheral fatigue into three major areas. What are they, and how might they lead to fatigue?
Kenney WL, Wilmore JH, Costil DL, ed., Physiology of Sport and Exercise. 5th ed. 2012, Human Kinetics: Champaign, IL. ↵
Schoenfeld BJ, The mechanism of muscle hypertrophy and their application to resistance training. J Strength Cond Res, 2010. 24(10): p. 2857-2872. ↵
Kenney WL, Wilmore JH, Costil DL, ed., Physiology of Sport and Exercise. 5th ed. 2012, Human Kinetics: Champaign, IL. ↵
Horowits R, Kemper ES, Bishner ME, Podolsky RJ, A physiological role for titin and nebulin in skeletal muscle. Nature, 1986. 323: p. 160-164. ↵
Kenney WL, Wilmore JH, Costil DL, ed., Physiology of Sport and Exercise. 5th ed. 2012, Human Kinetics: Champaign, IL. ↵
Paulin D, and Xue Z, Desmin and Other Intermediate Filaments in Normal and Diseased Muscle, in Intermediate Filaments, J. Paramino, Editor. 2006, Landes Bioscience and Springer Science+Business Media. ↵
Tskhovrebova L, and Trinick J, Making muscle elastic: the structural basis of myomesin stretching. PLoS Biology, 2012. 10(2): p. e1001264. ↵
Kenney WL, Wilmore JH, Costil DL, ed., Physiology of Sport and Exercise. 5th ed. 2012, Human Kinetics: Champaign, IL. ↵
Kenney WL, Wilmore JH, Costil DL, ed., Physiology of Sport and Exercise. 5th ed. 2012, Human Kinetics: Champaign, IL. ↵
Costill DL, Fink WJ, Pollock ML, Muscle fiber composition and enzyme activities of elite distance runners. Med Sci Sports, 1976. 8: p. 96-100. ↵
Pette D, Plasticity of Muscle, ed. W.d. Gruyter. 1980, New York, NY. ↵
Costill DL, Fink WJ, Pollock ML, Muscle fiber composition and enzyme activities of elite distance runners. Med Sci Sports, 1976. 8: p. 96-100. ↵
Huxley AF, Muscle structure and theories of contraction. Prog Biophys Biophys Chem, 1957. 7: p. 255-318. ↵
Jontes JD, Theories of Muscle Contraction. Journal of Structural Biology, 1995. 115: p. 119-143. ↵
Faulker J, Claffin D, McCully K, Power output of fast and slow fibers from human skeletal muscles, in Human Muscle Power, N.M. N Jones, A McComas, Editor. 1986, Human Kinetics: Champaign, IL. ↵
Faulker J, Claffin D, McCully K, Power output of fast and slow fibers from human skeletal muscles, in Human Muscle Power, N.M. N Jones, A McComas, Editor. 1986, Human Kinetics: Champaign, IL. ↵
definition
A type of striated muscle tissue attached to bones via tendons, responsible for voluntary movements of the body.
A type of non-striated, involuntary muscle tissue found in the walls of hollow organs such as the intestines, blood vessels, bladder, and uterus.
A specialized type of striated, involuntary muscle found only in the walls of the heart. Cardiac muscle fibers are branched, interconnected, and typically contain a single nucleus.
A continuous band or sheet of connective tissue, primarily composed of collagen, that surrounds, stabilizes, and separates muscles, organs, and other internal structures.
A dense layer of irregular connective tissue that surrounds an entire skeletal muscle.
Bundles of skeletal muscle fibers grouped together within a muscle, surrounded by a connective tissue sheath called the perimysium.
A sheath of connective tissue that surrounds and binds together bundles of muscle fibers, known as fasciculi, within a skeletal muscle.
A delicate layer of connective tissue that surrounds each individual muscle fiber within a fasciculus.
A single, elongated, multinucleated cell that makes up skeletal muscle tissue. Muscle fibers contain myofibrils, which are composed of repeating units called sarcomeres—the basic contractile units of muscle.
The cell membrane that surrounds a muscle fiber (muscle cell).
Specialized stem cells located between the sarcolemma and the basal lamina of skeletal muscle fibers. They play a key role in muscle growth, repair, and regeneration by proliferating and differentiating into new muscle fibers or fusing with existing ones following injury or stress.
The cytoplasm of a muscle fiber (muscle cell). It is the gel-like substance that fills the space between the sarcolemma (muscle cell membrane) and the myofibrils (contractile structures).
Invaginations of the sarcolemma that penetrate into the interior of skeletal and cardiac muscle fibers, forming a network of membranous channels.
Enlarged regions of the sarcoplasmic reticulum located adjacent to the transverse tubules in skeletal and cardiac muscle fibers. They serve as major calcium storage sites and release calcium ions rapidly during excitation-contraction coupling, enabling efficient muscle contraction.
A specialized form of smooth endoplasmic reticulum found in muscle fibers, responsible for storing, releasing, and reabsorbing calcium ions (Ca²⁺) during the process of muscle contraction and relaxation.
The region within a sarcomere where the A band (containing thick myosin filaments) meets the I band (containing thin actin filaments).
A long, cylindrical organelle found in muscle fibers, composed of repeating units called sarcomeres that contain actin and myosin filaments.
A dense protein structure that defines the boundary of a sarcomere in striated muscle.
The basic functional unit of striated muscle, defined as the segment between two Z-disks. It contains organized thick (myosin) and thin (actin) filaments whose sliding interaction during contraction shortens the sarcomere, producing muscle movement.
A globular protein that plays a central role in the structure and function of muscle cells and many other types of cells.
A motor protein that plays a central role in muscle contraction and various types of cell movement.
The light region of a sarcomere that contains only thin (actin) filaments and spans across two adjacent sarcomeres, intersected by the Z-disk.
The dark region of a sarcomere that spans the entire length of thick (myosin) filaments, including areas where they overlap with thin (actin) filaments.
The central region of the A-band in a sarcomere that contains only thick (myosin) filaments and no thin (actin) filaments.
The central region of the A-band in a sarcomere where thick (myosin) filaments are linked together by supporting proteins. It helps stabilize the arrangement of thick filaments and maintains sarcomere structure during contraction.
A giant elastic protein that spans from the Z-disk to the M-line within a sarcomere, anchoring thick (myosin) filaments and providing structural stability and elasticity.
A large structural protein associated with thin (actin) filaments in skeletal muscle. It runs along the length of the actin filament, acting as a molecular ruler to regulate filament length and contribute to sarcomere stability.
A monomeric form of actin that polymerizes to form filamentous actin (F-actin) in muscle and non-muscle cells.
A regulatory protein that runs along the length of actin filaments in muscle fibers, blocking myosin-binding sites on actin in a relaxed state.
A regulatory protein complex attached to tropomyosin on actin filaments. It controls muscle contraction by binding calcium ions, which triggers a shift in tropomyosin to expose myosin-binding sites on actin.
A structural and regulatory protein located in the thick filament region of the sarcomere, near the M-line. It helps stabilize thick filaments and modulates cross-bridge formation between actin and myosin, influencing the speed and strength of muscle contraction.
A structural protein located in the M-line of the sarcomere that crosslinks thick (myosin) filaments and titin molecules. It provides mechanical stability to the sarcomere and helps maintain the alignment of thick filaments during muscle contraction.
An intermediate filament protein found in muscle cells that forms part of the cytoskeleton. It links adjacent myofibrils at the Z-disks and connects them to the cell membrane, providing structural integrity and maintaining alignment during contraction.
An enzyme that catalyzes the hydrolysis of ATP (adenosine triphosphate) into ADP (adenosine diphosphate) and inorganic phosphate (Pi), releasing energy that can be used to power various cellular processes.
(Also called slow-twitch fibers) are skeletal muscle fibers specialized for endurance and continuous, low-intensity activity. They rely primarily on aerobic metabolism for ATP production and are highly resistant to fatigue.
Skeletal muscle fibers specialized for rapid, powerful contractions. They rely primarily on anaerobic metabolism, fatigue quickly, and are suited for short bursts of high-intensity activity. Subtypes include Type IIa (fast oxidative-glycolytic) and Type IIx (fast glycolytic).
A fundamental rule of motor unit recruitment stating that motor units are activated in order of increasing size of their motor neurons. Smaller motor units, which typically contain slow-twitch (fatigue-resistant) fibers, are recruited first for low-force activities. As force demands increase, progressively larger motor units with fast-twitch fibers are recruited. This ensures efficient, smooth, and energy-conserving muscle activation.
A model explaining muscle contraction, stating that actin (thin) and myosin (thick) filaments slide past each other within the sarcomere without changing length. This sliding shortens the sarcomere, producing contraction, and is powered by ATP-driven cross-bridge cycling.
Also known as the cross-bridge cycle, it is the repeating sequence of events that occurs during muscle contraction at the molecular level.
The physiological process linking the electrical excitation of a muscle fiber (action potential) to its mechanical contraction. It involves calcium release from the sarcoplasmic reticulum, which enables actin–myosin interaction and sarcomere shortening.
The specialized synapse between a motor neuron and a skeletal muscle fiber where nerve impulses trigger muscle contraction. It includes the motor neuron terminal, synaptic cleft, and motor end plate, and relies on acetylcholine as the primary neurotransmitter.
The repetitive sequence of events during muscle contraction in which myosin heads bind to actin, perform a power stroke, release, and reset.
The force-generating step of the cross-bridge cycle in which the myosin head pivots after releasing inorganic phosphate, pulling the actin filament toward the center of the sarcomere. This movement shortens the sarcomere and contributes to muscle contraction.
A type of muscle contraction in which the muscle changes length while producing constant tension, resulting in movement of a load. It includes concentric contractions (muscle shortens) and eccentric contractions (muscle lengthens).
A type of muscle contraction in which the muscle generates force without changing its length, resulting in no visible movement of the joint. This occurs when the force produced equals the external load, such as holding a weight stationary.
A type of muscle contraction in which the muscle changes length at a constant speed throughout the entire range of motion, typically achieved using specialized equipment that controls the velocity of movement while accommodating resistance.
A type of isotonic muscle contraction in which the muscle shortens while generating force, typically occurring when lifting a load or moving against resistance.
A type of isotonic muscle contraction in which the muscle lengthens while generating force, typically occurring when lowering a load or resisting an external force.
Muscle contractions in which tension is generated without a change in muscle length, resulting in no visible joint movement. These occur when the force produced equals the external resistance, such as holding a weight in a fixed position.
A single, brief contraction and relaxation cycle of a muscle fiber in response to one action potential. It consists of three phases: latent period, contraction phase, and relaxation phase.
The additive effect of multiple muscle twitches occurring in rapid succession, leading to a greater overall force of contraction. It occurs because the muscle does not fully relax between stimuli, allowing calcium levels to remain elevated.
A sustained and continuous contraction of a muscle resulting from rapid, repeated stimulation without sufficient relaxation between stimuli. It occurs when the frequency of nerve impulses is high enough that individual muscle twitches fuse into a smooth, prolonged contraction.
.jpg)
.svg)

.svg)