French 100 meter runner Christine Arron, a retired track and field sprinter, during her first round heat at the World Athletics Championships on August 26, 2007, in Osaka. In July 2013, she was the world’s fifth-fastest female 100-meter sprinter (10.73 sec) and holds the European record for this distance.
Learning Objectives
Define muscle fatigue and differentiate between central and peripheral fatigue.
List and explain the primary causes of muscle fatigue, including energy delivery, metabolic by-products, heat production, contractile mechanism failure, and neuromuscular control alterations.
Discuss the role of lactate production in buffering hydrogen ions during exercise.
Explain the concept of metabolic acidosis and its impact on muscle performance.
Describe the lactate threshold and its significance in endurance performance.
Explain the hypotheses for the lag in oxygen utilization at the onset of exercise.
Define excess post-exercise oxygen consumption (EPOC) and its physiological significance.
Describe the exercise principles of specificity and progressive overload.
Identify the metabolic adaptations to anaerobic and aerobic exercise.
Introduction
Exercise significantly disrupts metabolic homeostasis in skeletal muscle. During intense physical activity, the body’s total energy expenditure can surge to levels 15 to 25 times higher than at rest. Skeletal muscles exhibit a remarkable ability to generate and utilize substantial amounts of ATP during exercise, and they can modify their metabolic processes to enhance their energy expenditure capacity. This chapter will explore the following topics:
The scientific definition and underlying causes of exercise-induced fatigue.
The metabolic responses observed at the onset of exercise and during the recovery phase.
The selection of energy substrates used for ATP production.
The long-term metabolic adaptations resulting from aerobic and anaerobic exercise training.
Muscle Fatigue and Metabolic Acidosis
Muscle fatigue can be broadly defined as the inability to maintain the required or expected force[1]. It is a complex and multifactorial phenomenon, often described as a decline in muscle performance with continued effort, accompanied by a sensation of tiredness[2]. The sites of fatigue are generally categorized into two types: central fatigue, which includes any site from the brain to the neuromuscular junction, and peripheral fatigue, which encompasses any physiological site from the neuromuscular junction into the muscle. The specific site of fatigue can vary depending on the type of exercise. For instance, fatigue experienced during a 400-meter run differs significantly from that during a marathon.
Researchers have identified several key areas to determine the underlying causes and sites of fatigue:
Decreased rate of energy delivery (PCr-ATP, glycolysis, oxidative phosphorylation).
Accumulation of metabolic by-products such as H+.
Heat produced as a by-product of energy expenditure.
Failure of the muscle fiber’s contractile mechanisms.
Alterations in neuromuscular control.
The first four causes are often referred to as peripheral fatigue. Other mechanisms of peripheral fatigue include acetylcholine breakdown at the neuromuscular junction, H+ accumulation inside the muscle cell (acidosis), competitive binding of H+ with calcium, and disruption of ATPase activity. Environmental factors, such as ambient temperature, also affect fatigue. For example, men cycling at 70% VO2max experienced delayed fatigue in cooler environments (11°C) compared to hotter ones (21°C and 31°C)[3]. Pre-cooling muscles can prolong exercise, while preheating can cause earlier fatigue[4].
Other factors that affect fatigue are the types and intensity of exercise, environmental conditions, the fiber types of the involved muscles, the subject’s training status, and even the athlete’s diet. Changes in the brain or central nervous system may also cause central fatigue but none of these alone can explain all aspects of fatigue. Undoubtedly, the central nervous system (CNS) also may be a site of fatigue. It has been shown that verbal encouragement, shouting, playing of music, or even direct electrical stimulation of the muscle can increase the strength of muscle contraction. However, the precise mechanisms underlying the CNS role in fatigue are still not fully understood. Keep in mind that fatigue is rarely caused by a single factor but possibly many factors acting at multiple sites.
Acidosis
For over 90 years, lactic acidosis has been a classic explanation for acidosis during exercise. This theory posits that lactic acid production during intense exercise causes acidosis, leading to fatigue. However, a 2004 review by Robert Robergs, PhD, and colleagues challenged this view, presenting evidence that lactate production actually retards acidosis rather than causing it[5]. They argued that acidosis results from reactions other than lactate production and that the concept of lactic acidosis is a construct rather than a fact.
In skeletal muscle, acidosis is caused by cytosolic catabolism, leading to an accumulation of hydrogen ions (H+) in the sarcoplasm. This accumulation decreases muscle pH from a resting value of 7.1. It is crucial that muscle pH does not drop below 6.6 to 6.4, as this could cause physiological damage or cell death. An intracellular pH below 6.9 inhibits phosphofructokinase activity, slowing glycolysis and ATP production. At a pH of 6.4, H+ accumulation halts glycogen breakdown, causing a rapid decrease in ATP and leading to exhaustion. Most researchers agree that low muscle pH is a major limiter of performance and a primary cause of fatigue during maximal, all-out exercise lasting more than 20 to 30 seconds.
Researchers now agree that ATP hydrolysis coupled with glycolysis is the main source of proton (H+) production, leading to decreased muscle and blood pH[6][7][8]. ATP hydrolysis releases a free proton, contributing significantly to acidosis when proton removal does not balance proton production.
By understanding these mechanisms, we can better appreciate the complex interplay of factors that contribute to muscle fatigue and acidosis during exercise. Recall that ATP hydrolysis (catalyzed by ATPase) results in the release of a free proton as shown below. This reaction is thought to be a major contributor to acidosis under conditions where proton removal is not balanced with proton production.
ATP + H₂O → ADP + Pi + energy + H+
The second most accepted cause of acidosis is the release of protons from several reactions in glycolysis. While this textbook does not provide an exhaustive examination of the biochemistry of acidosis, it is important to note that specific steps in glycolysis (steps 1, 3, and 6) release protons (H+). Conversely, step 10 in glycolysis consumes two protons, acting as a buffering reaction that removes protons from the cytosol. Thus, the net proton yield of glycolysis is 2 H+.
In addition to generating energy, cells possess mechanisms to buffer and remove H+. These include intracellular proteins, mitochondrial transport, bicarbonate (HCO3–), lactate production, and the export of H+ to the blood. It is crucial to understand that metabolic acidosis is not solely caused by proton release from metabolic reactions but by an imbalance between the rate of proton release and the rate of buffering and removal.
Lactate Formation and Redox Potential
The redox potential of muscle cells to continuously produce ATP depends on the availability of NAD+ to accept hydrogen from various metabolic steps. During aerobic metabolism, NADH+H+ shuttles hydrogen to the mitochondria via the glycerol phosphate shuttle, where it is oxidized back to NAD+, allowing it to continue accepting hydrogen. Chapter 4 detailed the steps of carbohydrate metabolism, including the net yield of glycolysis: two NADH+H+, two pyruvate molecules, two ATP, and two H2O.
During rest and steady-state exercise, pyruvate is oxidized in the mitochondria into acetyl CoA, and mitochondrial respiration proceeds. Oxygen serves as the final electron acceptor, enabling a steady rate of glycolysis. However, during high-intensity exercise, the oxygen demands of the cell exceed the supply, inhibiting the ability of NADH+H+ to shuttle hydrogen into the mitochondria. When oxygen is unavailable to accept electrons in the mitochondria, NADH+H+ accumulates in the cytosol.
To improve the redox potential (i.e., increase the amount of NAD+ available for glycolysis), pyruvate can accept hydrogen from NADH+H+, converting into lactate. This redox reaction, catalyzed by the enzyme lactate dehydrogenase, results in the formation of lactate and the reformation of NAD+. The lactate dehydrogenase (LDH) reaction is a crucial buffering mechanism that allows glycolysis to continue under strenuous exercise conditions. The lactate dehydrogenase reaction important for generating lactate is shown:
Pyruvate + NADH + H⁺ ⇌ Lactate + NAD⁺
The formation of lactate allows NAD+ to return to step 6 of glycolysis to accept more hydrogen, thereby enabling glycolysis to continue. Importantly, the lactate dehydrogenase reaction does not result in a net production of protons. Consequently, lactate production serves as a crucial H+ buffering reaction, allowing sustained exercise. Without lactate production, skeletal muscle would rapidly experience acidosis and fatigue, severely diminishing exercise performance[9]. The lactate dehydrogenase (LDH) reaction is reversible, allowing lactate to be converted back to pyruvate under resting conditions.
Lactate Threshold (LT)
Once produced in the muscle during exercise, lactate can be transported out of the muscle fiber through specialized transport proteins, such as monocarboxylate transporter proteins, into the blood. This export of lactate can be measured during exercise and is used to predict endurance performance in athletes. Historically, maximal oxygen uptake (VO2max) was considered the best measure of endurance capacity. While VO2max is valid for short-term endurance workloads leading to exhaustion within 3-10 minutes, it is insufficient for assessing performance capacity during middle-term (10-30 minutes) and long-term (> 30 minutes) workloads[10].
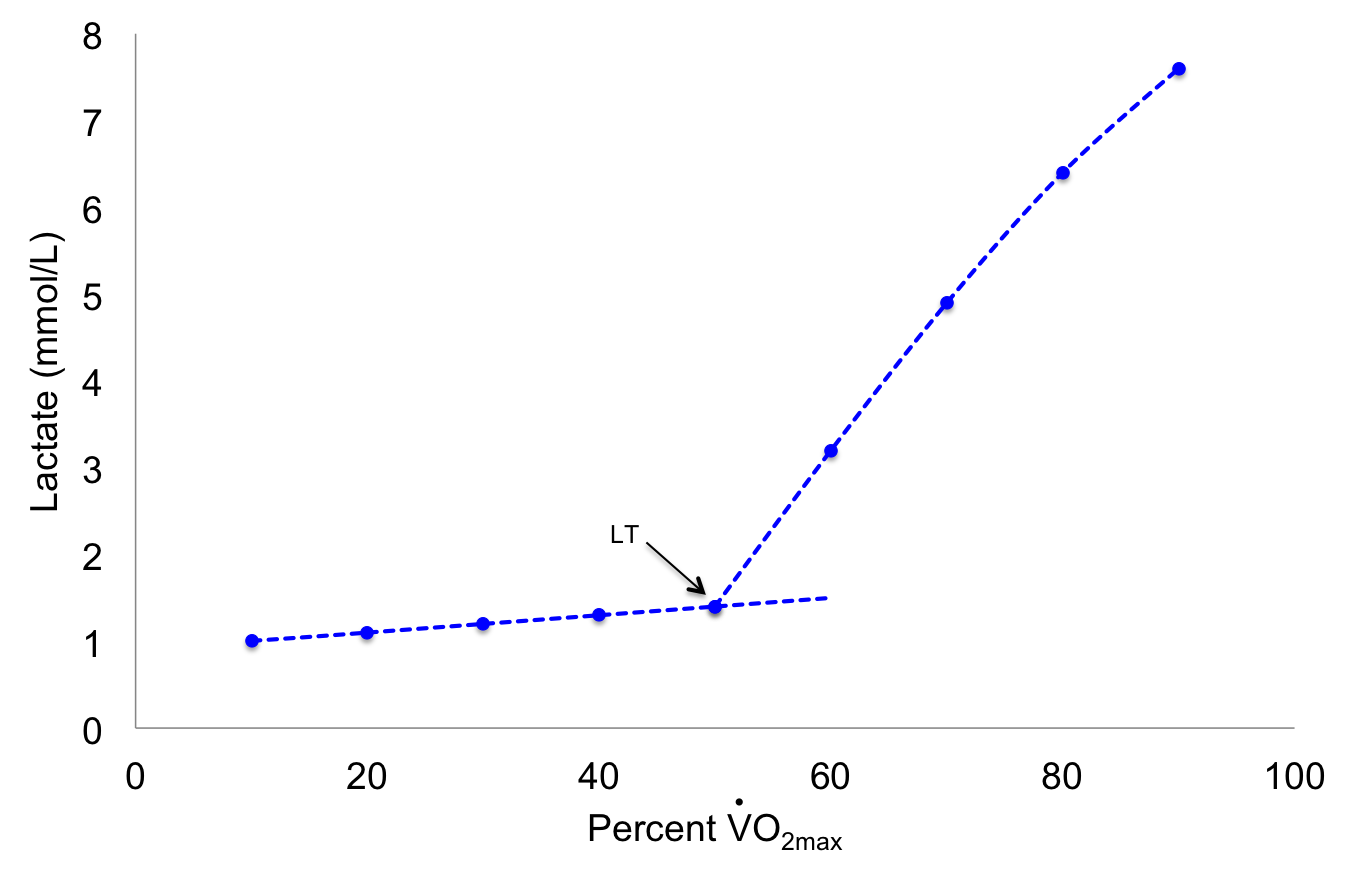
A more accurate measure of middle- and long-term endurance exercise capacity is the lactate threshold. Often synonymous with the anaerobic threshold due to the link between anaerobic metabolism and lactate appearance, the term “lactate threshold” is preferred for its accuracy[11]. The lactate threshold (LT) is the point at which there is an exponential rise in blood lactate levels during incremental exercise. It indicates an increasing reliance on anaerobic metabolism (i.e., glycolysis) and can predict success in distance running. Figure 5.1 illustrates changes in blood lactate concentration during incremental exercise and identifies the lactate threshold inflection point.
Figure 5.1 The lactate threshold is indicated with an arrow as point where there is a sudden rise in lactate during incremental exercise.
Another term used to describe the systematic rise in blood lactate concentration is the onset of blood lactate accumulation (OBLA). Unlike the lactate threshold (LT), OBLA is defined as the exercise intensity (or oxygen consumption) at which a lactate concentration of 4 millimoles per liter of blood is achieved[12]. The threshold value of 4 mmol/L is not a criterion for the LT, which is usually expressed as a percentage of VO2max. The LT is one of the best determinants of an athlete’s optimal pace in events such as cycling or running. It has practical applications for optimizing training programs and predicting success in endurance athletes. Generally, the LT occurs at 50-60% VO2max in untrained individuals and at 70-80% VO2max in elite endurance-trained athletes[13]. Coaches can use the LT to plan exercise intensity levels to optimize training results, such as selecting a training heart rate based on the LT. Several mechanisms may contribute to the lactate threshold during increasing exercise intensities:
Low muscle oxygen.
Accelerated glycolysis.
Recruitment of fast-twitch fibers.
Reduced rate of lactate removal.
As exercise intensity increases, more muscular force is required, leading to the recruitment of fast-twitch muscle fibers. These fibers rely on anaerobic metabolism (i.e., glycolysis), resulting in increased lactate production. Another mechanism involves the balance between lactate production in skeletal muscle and its removal by other tissues, such as the liver and heart. At any given time during exercise, some muscles produce lactate while other tissues remove it. Therefore, blood lactate concentration depends on the rate of lactate entry into the blood and its removal rate[14]. A rise in blood lactate concentration can occur due to either increased lactate production or decreased lactate removal. These mechanisms remain controversial, but it is likely that a combination of factors explains the lactate threshold.
Ventilatory Threshold (VT)
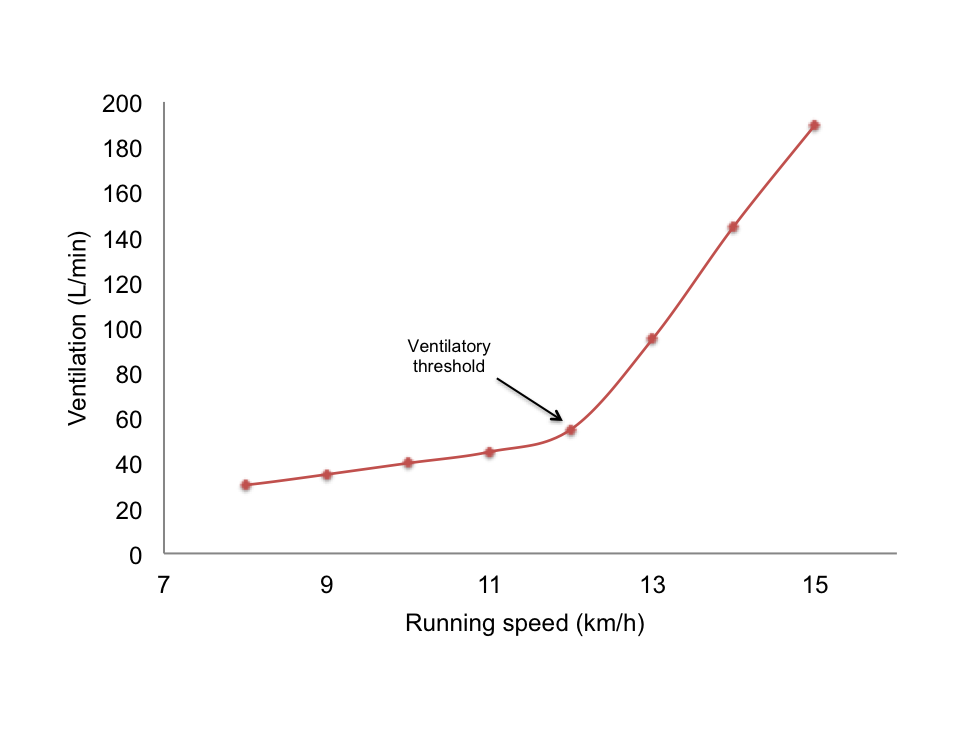
Figure 5.2 Changes in the rate of pulmonary ventilation (VE) during running at increasing speeds, illustrating the ventilatory threshold.
The original purpose of determining the ventilatory threshold (Figure 5.2) was to provide a noninvasive alternative to blood sampling for detecting the onset of the “anaerobic threshold” or lactate threshold. Although the term “anaerobic threshold” remains controversial, the ventilatory threshold offers a means to assess changes in exercise metabolism without invasive procedures. During moderate, steady-state exercise, ventilation increases in proportion to the rate of metabolism, paralleling oxygen uptake. The ventilatory equivalent of oxygen (VE/VO2) is the ratio between the volume of air expired (VE) and the amount of oxygen consumed by the tissues (VO2) over a given time. At rest, VE/VO2 ranges from 23 to 28 L of air per liter of oxygen and changes minimally during mild exercise. However, as exercise intensity approaches maximal levels, VE/VO2 can exceed 30 L of air per liter of oxygen consumed.
The ventilatory threshold is the point during incremental exercise where ventilation increases disproportionately compared to oxygen consumption, typically occurring between 55% to 70% of VO2max[15]. This disproportionate increase in ventilation is likely due to rising carbon dioxide levels during intense exercise, which stimulate chemoreceptors that signal the inspiratory center to increase ventilation. Beyond the ventilatory threshold, ventilation increases dramatically, making it difficult to maintain a steady state of exercise. Exercise physiologists can estimate the lactate threshold by identifying the point where VE/VO2 starts to increase while VE/VCO2 continues to decline.
VO2 Drift
Exercise significantly increases energy requirements beyond resting metabolism. Metabolism rises in direct proportion to exercise intensity during sub-maximal exercise bouts. At higher exercise intensities, the oxygen uptake (VO2) response does not follow the typical steady-state pattern, where oxygen consumption stabilizes within 1 to 2 minutes. Instead, VO2 continues to increase, a phenomenon known as the slow component of oxygen uptake kinetics, likely due to changes in muscle fiber recruitment[16]. The recruitment of more type II muscle fibers, which are less efficient, necessitates a higher VO2 to achieve the same power output.
Generally, a steady-state VO2 can be maintained during prolonged, moderate-intensity exercise. However, in hot or humid environments or at high work rates, an upward “drift” in VO2 over time can occur, preventing the attainment of a steady state[17]. VO2 drift is defined as a slow increase in VO2 during prolonged sub-maximal, constant power output exercise. It is observed at power outputs well below the lactate threshold, with a smaller magnitude of increase. The exact cause of VO2 drift is not fully understood but is thought to be related to increased circulating catecholamines[18].
Substrate Utilization During Exercise
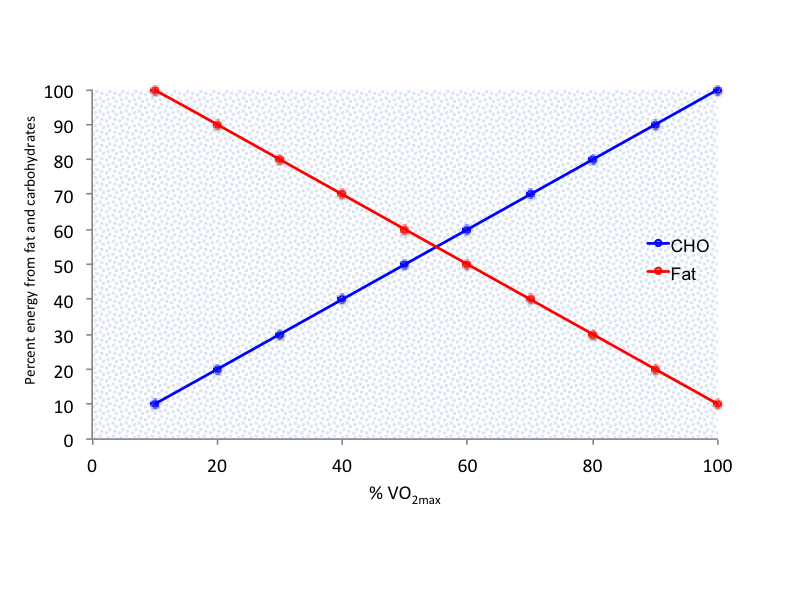
Figure 5.3 Illustration of the crossover concept. As exercise intensity increases, there is a progressive increase in the utilization of carbohydrate (CHO) as a substrate for energy production.
The pattern of substrate utilization during exercise depends on the interaction between exercise intensity and duration. Increased exercise intensity results in greater carbohydrate (CHO) utilization compared to fat[19]. Conversely, endurance training promotes lipid oxidation, making fats the dominant fuel source during prolonged exercise. Brooks and Mercier confirmed that at low exercise intensities (≤ 45% VO2max), lipid is the main substrate, while at high intensities (~75% VO2max), carbohydrate predominates[20]. This shift from fat to carbohydrate metabolism as exercise intensity increases is known as the crossover concept (Figure 5.3).
Physiologically, this change is due to the recruitment of fast-twitch fibers, which contain many glycolytic enzymes and thus utilize more glucose for ATP production. Additionally, increased blood levels of epinephrine associated with higher exercise intensities cause muscle glycogen breakdown.
Recovery from Exercise: Metabolic Responses
At the onset of exercise, metabolic changes in skeletal muscle must occur rapidly to provide the necessary energy for movement. Measuring O2 consumption during exercise offers an indirect assessment of metabolism. There is a direct relationship between O2 utilization in the electron transport chain and ATP generation. Research shows that during the transition from rest to light or moderate exercise, O2 consumption increases rapidly, reaching a steady state within 1 to 4 minutes[21][22]. Initially, anaerobic energy sources (CrP-ATP and glycolysis) contribute to ATP production until a steady state is achieved.
Trained individuals reach steady state faster than untrained subjects[23]. It is important to note that all metabolic systems operate with considerable overlap, and no single pathway generates the entire ATP contribution at any time.
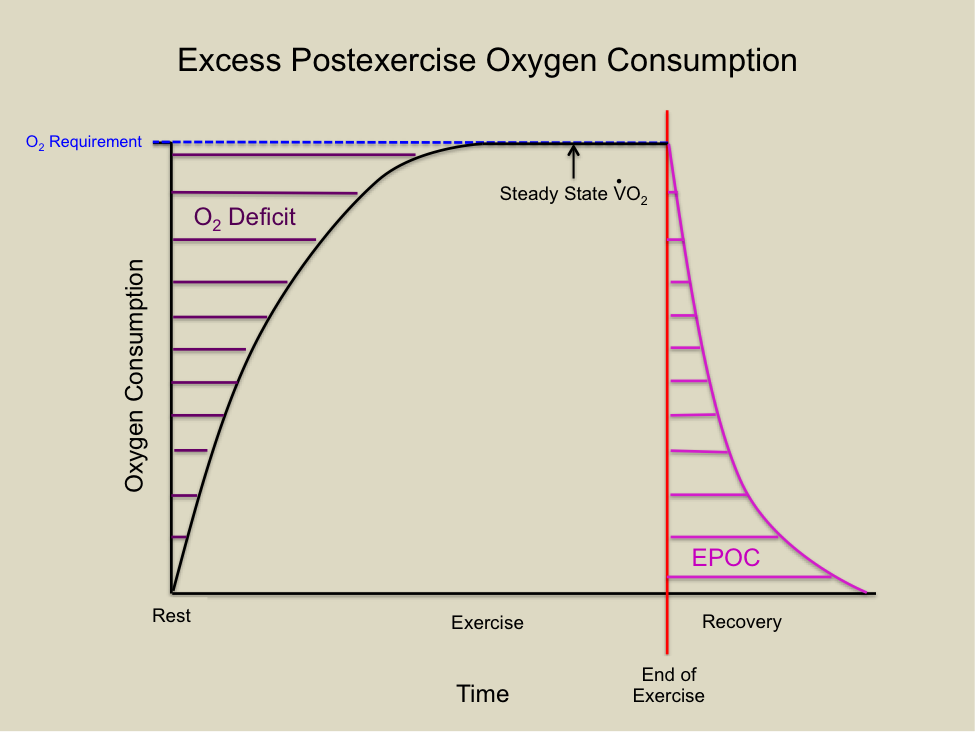
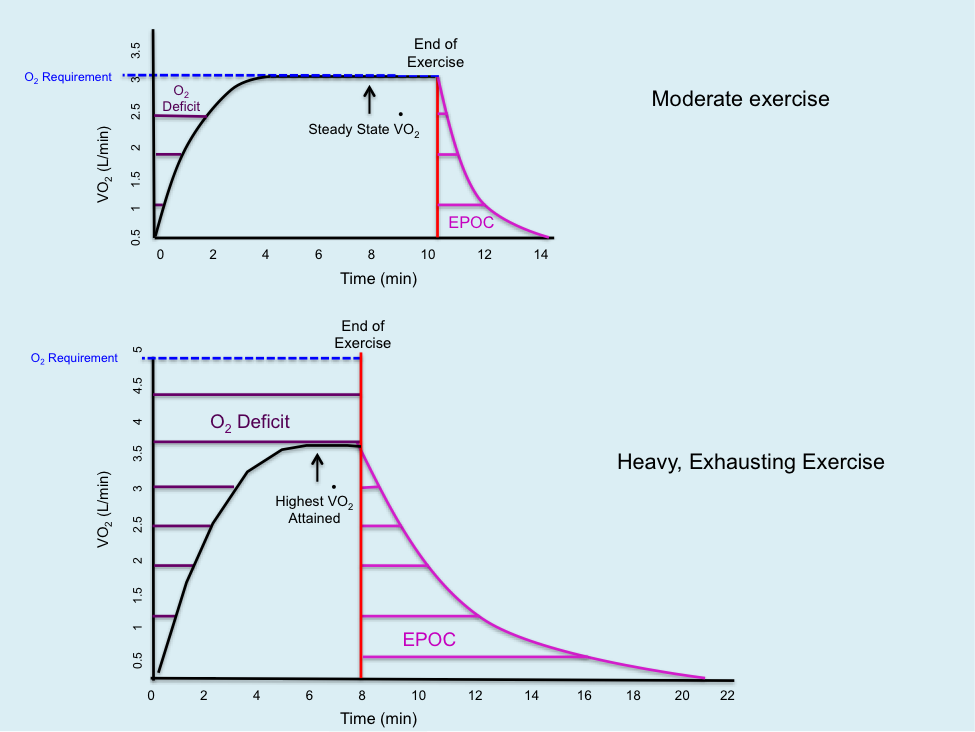
Oxygen Deficit
The lag in oxygen consumption at the start of exercise is termed the oxygen deficit. This can be measured through indirect calorimetry as the difference between oxygen uptake in the first few minutes of exercise and an equal time period after steady state is reached. The oxygen deficit affects mitochondrial respiration’s ability to generate ATP. During this period, ATP demands are met by the phosphagen and glycolytic systems (anaerobic metabolism). The oxygen deficit continues until a steady state of oxygen consumption is achieved. The degree of oxygen deficit can be influenced by exercise intensity and duration, providing insights into the control of oxidative phosphorylation.
Figure 5.4 The oxygen deficit during moderate exercise and the excess post-exercise oxygen consumption (EPOC) following exercise during recovery. Oxygen requirement and steady state oxygen consumption are also shown.
Two main hypotheses may explain the lag in oxygen utilization at the onset of exercise. The first hypothesis suggests an inadequate supply of oxygen to the muscles, meaning there is insufficient oxygen to accept electrons at the end of the electron transport chain (ETC), thereby restricting whole-body oxygen consumption. The second hypothesis posits that there is a delay because the stimuli for oxidative phosphorylation require time to reach their full effects. Metabolic pathways are highly regulated and often activated when concentrations of ADP and Pi increase due to exercise. As CrP is broken down, ADP and Pi concentrations rise, gradually stimulating oxidative phosphorylation until it meets the energy demands of the exercise. Research supports both hypotheses, suggesting that regulators of oxidative phosphorylation interact to provide the overall stimulus under various exercise conditions.
Excess Post-exercise Oxygen Consumption (EPOC)
Historically, the term “oxygen debt” was used to describe the elevated oxygen uptake following exercise, coined by British physiologist Archibald Vivian (A.V.) Hill. He observed that oxygen debt could be divided into a rapid portion (2-3 minutes post-exercise) and a slow portion (persisting for over 30 minutes)[24][25]. The rapid portion was thought to re-synthesize ATP and CrP and replenish tissue oxygen stores (~20% of oxygen debt), while the slow portion (~80% of oxygen debt) was attributed to the oxidative conversion of lactate to glucose in the liver. However, recent evidence shows that only 20% of the oxygen debt is used for lactate to glucose conversion, leading to the term’s controversy and eventual replacement.
The term “excess post-exercise oxygen consumption” (EPOC) is now used to describe the recovery period after cardiovascular exercise, where oxygen consumption remains elevated. EPOC is the amount of oxygen consumed during recovery beyond what would be consumed at rest. It occurs until physiological variables return to homeostasis, including CrP replenishment, lactate metabolism, glycogen re-synthesis, and hormone recovery. During this period, increased oxygen demand helps the body achieve homeostasis by lowering body temperature, adjusting heart rate and ventilation, and re-oxygenating hemoglobin.
Exercise intensity affects the duration of the oxygen deficit and EPOC. Compared to moderate-intensity exercise, EPOC is greater during high-intensity, exhaustive exercise due to higher heat production, greater CrP depletion, higher blood lactate levels, and elevated epinephrine and norepinephrine levels. Figure 5.5 illustrates the differences in the duration of EPOC and the oxygen deficit during moderate- and heavy-intensities of exercise.
Figure 5.5 A comparison of the oxygen deficit and EPOC at (A) moderate exercise, and (B) heavy, exhausting exercise.
Metabolic Changes with Exercise Training
For exercise professionals, understanding metabolism and distinguishing between exercise duration and intensity is crucial. The exercise principle of specificity states that adaptations are specific to the type of training, which applies directly to training metabolic pathways. Metabolic adaptations result from targeting specific systems through exercise training. Intensity is typically expressed as a percentage of maximal oxygen consumption (%VO2max), maximum speed, the percentage of one repetition maximum (% 1RM), or the athlete’s maximum heart rate (MHR). Both duration (long or short) and intensity (high or low) should be considered when training for a particular sport or event. Most sports require a combination of anaerobic and aerobic pathways to produce the ATP needed for performance.
Short-Term, Intense Exercise
The energy required for short-term, high-intensity exercise primarily comes from anaerobic metabolic pathways. The CrP-ATP and glycolytic systems both contribute to ATP generation, with their contributions depending on the activity’s duration. For example, during a 50-meter dash or a single play in American football, the CrP-ATP system predominantly provides ATP[26]. For events lasting longer than 45 seconds, such as a 400-meter dash or an extended volleyball rally, a combination of CrP-ATP, glycolysis, and mitochondrial respiration generates ATP. Intense exercise lasting about 60 seconds utilizes 70% anaerobic and 30% aerobic systems, while events lasting 2 to 3 minutes use both systems equally.
Anaerobic training, defined as exercise performed at intensities above VO2max, aims to stimulate anaerobic energy pathways. Speed training involves high-intensity anaerobic training lasting 2-10 seconds, while speed endurance training refers to anaerobic training lasting longer than 10 seconds[27]. It is important to target specific muscle groups required by the athlete during competitions. Some research suggests that CrP-ATP efficiency may increase with anaerobic training, though this is debated. Training to improve the CrP-ATP system involves short, high-intensity intervals (5-10 seconds) targeting specific muscles. Other research indicates that enzyme efficiency (phosphorylase, PFK, and LDH) can increase by 10-25% with repeated 30-second training bouts.
A significant factor in high-intensity training is the ability to decrease acidosis and fatigue through matching buffering activity. Buffering capacity can improve by 12-50% with anaerobic training. Buffers such as bicarbonate (HCO3–), muscle phosphates (HPO42-), and increased lactate production (via lactate dehydrogenase) help delay acidosis, reduce fatigue, and enhance performance.
Figure 5.6 This figure depicts the legendary Greek athlete Milo of Croton, renowned for his extraordinary strength. In the scene, Milo is shown attempting to tear apart a tree by hand—a feat of hubris. His hand becomes stuck in the partially split trunk, rendering him vulnerable. Wild animals, likely wolves or lions, are depicted encircling him, symbolizing his tragic demise as told in ancient myth.
The exercise principle of progressive overloadis crucial for metabolic training adaptations. It states that a training program must stress the system beyond its accustomed level to induce adaptations. Muscles increase in strength and energy generation capability by contracting at relatively high tensions and will not adapt unless overloaded[28]. The first application of this principle was by Milo of Crotona, a famous Olympic wrestler from 500 B.C. Milo’s training involved carrying a bull calf on his back daily, continuing until the animal matured (Figure 5.6). This story illustrates the principle of progressive overload, which is now applied by athletes through lifting heavy objects. Progressive overload is essential for developing not only strength and performance enhancements but also for adapting metabolic pathways to improve energy generation capabilities.
Prolonged Exercise
The energy for long-term exercise (more than 10 minutes) primarily comes from oxidative phosphorylation (aerobic metabolism). A steady-state VO2 can generally be maintained during sub-maximal, moderate-intensity exercise if body temperature and hormonal concentrations are stable. Oxygen consumed is used in the electron transport chain (ETC) to accept electrons, driving redox reactions that create ATP. Improving VO2 is key to enhancing endurance performance and involves several physiological factors, from oxygen binding to hemoglobin to utilization within mitochondria.
Endurance training can improve VO2max by 15-20%, depending on initial fitness levels. Typically, endurance training involves prolonged bouts of low-to-moderate intensity exercise that overload the muscles. Type I muscle fibers, recruited at this intensity, can increase in size (muscle hypertrophy) by 7-22%. A critical adaptation is an increase in capillary supply to trained muscles, enhancing oxygen delivery. Myoglobin content, which shuttles oxygen from the cell membrane to mitochondria, increases by 75-80% with endurance training. Mitochondria can also increase in number and size, with cardiovascular training boosting them by 15% and 35%, respectively. Mitochondrial enzymes can increase 2.5 times even after training stops.
Trained muscles can store more glycogen and twice as much intramuscular fat for use during exercise compared to untrained individuals. During prolonged exercise, there is a gradual shift from carbohydrate metabolism to fat oxidation, initiated by epinephrine and norepinephrine hormones that trigger lipolysis. Fat oxidation requires more oxygen than carbohydrate oxidation, making lipolysis a slower process. A study on muscle triglyceride utilization during exercise found that after a 12-week training program, subjects increased their triglyceride utilization and decreased glycogen utilization, demonstrating that fat utilization increases with endurance training [29]. Fatty acid oxidation can increase by up to 30% with training.
Figure 5.7 This figure shows the bronze statue of Pheidippides, located along the historic Marathon Road in Greece. Pheidippides is depicted in mid-stride, muscular and determined, symbolizing his legendary run from the battlefield at Marathon to Athens to announce the Greek victory over the Persians in 490 B.C. This mythological event is widely regarded as the inspiration for the modern marathon race. The statue stands as a tribute to endurance, athleticism, and the historical roots of long-distance running.
Distance running has seen remarkable performance improvements over the past century. One study hypothesized that a marathon could be completed in under 2 hours by the year 2100, though the results were inconclusive [30]. Nevertheless, the marathon remains one of the most popular commercialized running races. Endurance events like the marathon primarily rely on aerobic ATP production. Proper conditioning of the aerobic systems is crucial for marathon runners to sustain their race pace and recover adequately.
The history of the marathon is an interesting tale that highlights the importance of training for such feats of endurance. The story begins with the Athenian victory over the Persians at the Battle of Marathon. Following the battle, Athens reached new heights of prosperity as democracy blossomed, laying the foundation for Western civilization. According to legend, the Greek messenger Pheidippides ran from the battlefield at Marathon to Athens to relay news of the victory. Upon arriving in Athens, he exclaimed, “We were victorious!” and then collapsed and died from exhaustion. Figure 5.7 shows a statue commemorating Pheidippides run that inspired the modern marathon event, which was introduced at the 1896 Modern Olympics.
While the story of Pheidippides is tragic and extreme, modern training protocols and methods for endurance training have shown significant benefits. Endurance training improves many cardiovascular risk markers, including body weight, blood lipids, and blood pressure. Additionally, endurance training positively affects metabolic factors and helps delay metabolic diseases.
Chapter Summary
In conclusion, this chapter has provided an in-depth exploration of the metabolic challenges and adaptations associated with exercise. We examined how exercise disrupts metabolic homeostasis in skeletal muscle, leading to significant increases in energy expenditure and necessitating rapid metabolic responses. The causes and sites of muscle fatigue were analyzed, highlighting the complex interplay between central and peripheral factors.
We discussed the critical role of lactate production in buffering hydrogen ions and preventing rapid acidosis, as well as the concept of the lactate threshold and its importance for endurance performance. The chapter also covered the lag in oxygen utilization at the onset of exercise and the significance of excess post-exercise oxygen consumption (EPOC) in recovery.
Metabolic adaptations to both anaerobic and aerobic exercise were explored, emphasizing the principles of specificity and overload. These principles are essential for developing metabolic pathways that enhance energy generation and overall athletic performance. The historical perspective on marathon running underscored the importance of proper training and conditioning for endurance athletes, illustrating how modern training methods have evolved to improve both physiological and metabolic outcomes.
Overall, this chapter has provided a comprehensive understanding of the metabolic processes involved in exercise and training, offering valuable insights for optimizing athletic performance and promoting long-term health.
Scholarly Questions
What is the ventilatory threshold? How is it different from the lactate threshold?
Approximately how long does it take to achieve steady state VO2?
What are the causes of acidosis/H+ production?
So, is lactate really causing the acidosis? If not, what would this be?
Explain how with glycolytic training, there is an increase in buffering capacity.
What are the names of some buffers? What are they doing?
If the pH goes below 7, is the concentration more or less acidic?
What two energy systems are providing the majority of ATP during the oxygen deficit? What energy system is providing the majority of ATP during steady state?
What are the factors of EPOC? What does EPOC stand for and what does it mean? Be able to graph the following items: oxygen deficit, EPOC, steady state VO2, and the oxygen requirement.
With very short burst training, what adaptations do we see to the phosphagen system?
What are the aerobic and anaerobic metabolic adaptations with training? How do these adaptations improve the ability to continue exercise?
With aerobic exercise, what VO2max improvement range can be expected?
With aerobic training, can Type I fibers hypertrophy? If so, by how much?
Of the Type IIa and Type IIb/x fibers, which would be used more in aerobic exercise?
A key adaptation of aerobic training is capillary supply. How much of an increase may be seen?
If the number of capillaries increases, how does this affect O2, CO2, nutrients, and waste products?
What does myoglobin do? Which fiber type, Type I or Type II, is higher in myoglobin? How much may myoglobin increase with aerobic training?
Does mitochondrial function improve with aerobic training? Explain.
How much do mitochondrial oxidative enzymes increase due to aerobic training?
Aerobically trained muscle can oxidize fatty acids better. By what percentage does this ability increase?
What is the difference between an acute response and a chronic adaptation to exercise? Can you give some examples of each?
What are the major types of muscle fibers discussed in class? Which type is recruited for endurance (aerobic) exercise? Which type is recruited for short-term, high-intensity (anaerobic) exercises? Which fiber type has oxidative characteristics? Which has glycolytic characteristics?
MacIntosh BR, Gardiner PF, McComas AJ, Skeletal muscle: Form and Function. 2006: Human Kinetics. ↵
Kenney LK, Wilmore JH, Costil DL, ed., Physiology of Sport and Exercise. 5th ed. 2012, Human Kinetics: Champaign, IL. ↵
Galloway SDR, and Maughan RJ, Effects of ambient temperature on the capacity to perform prolonged cycle exercise in men. Medicine and Science in Sports and Exercise, 1997. 29: p. 1240-1249. ↵
Kenney LK, Wilmore JH, Costil DL, ed., Physiology of Sport and Exercise. 5th ed. 2012, Human Kinetics: Champaign, IL. ↵
Robergs RA, Ghiasvand F, Parker D, The biochemistry of exercise-induced metabolic acidosis. Am J Physiol Regul Integr Comp Physiol, 2004. 287: p. R502-R516. ↵
Kenney LK, Wilmore JH, Costil DL, ed., Physiology of Sport and Exercise. 5th ed. 2012, Human Kinetics: Champaign, IL. ↵
Robergs RA, Ghiasvand F, Parker D, The biochemistry of exercise-induced metabolic acidosis. Am J Physiol Regul Integr Comp Physiol, 2004. 287: p. R502-R516. ↵
Busa WB, and Nuccitelli R, Metabolic regulation via intracellular pH. Am J Physiol Regul Integr Comp Physiol, 1984. 246: p. R409-R438. ↵
Robergs RA, Ghiasvand F, Parker D, The biochemistry of exercise-induced metabolic acidosis. Am J Physiol Regul Integr Comp Physiol, 2004. 287: p. R502-R516. ↵
. Heck H, Mader A, Hess G, Mucke S, Muller R, and Hollmann W, Justification of the 4-mmol/l Lactate Threshold. Int J Sports Med, 1985. 6: p. 117-130. ↵
Powers SK, and Howley ET, Exercise Physiology (Theory and Application to Fitness and Performance). 9th Edition ed. 2015, New York, NY: McGraw-Hill. ↵
. Heck H, Mader A, Hess G, Mucke S, Muller R, and Hollmann W, Justification of the 4-mmol/l Lactate Threshold. Int J Sports Med, 1985. 6: p. 117-130. ↵
Kenney LK, Wilmore JH, Costil DL, ed., Physiology of Sport and Exercise. 5th ed. 2012, Human Kinetics: Champaign, IL. ↵
5. Powers SK, and Howley ET, Exercise Physiology (Theory and Application to Fitness and Performance). 9th Edition ed. 2015, New York, NY: McGraw-Hill. ↵
Kenney LK, Wilmore JH, Costil DL, ed., Physiology of Sport and Exercise. 5th ed. 2012, Human Kinetics: Champaign, IL. ↵
. Kenney LK, Wilmore JH, Costil DL, ed., Physiology of Sport and Exercise. 5th ed. 2012, Human Kinetics: Champaign, IL. ↵
Powers SK, and Howley ET, Exercise Physiology (Theory and Application to Fitness and Performance). 9th Edition ed. 2015, New York, NY: McGraw-Hill. ↵
Kenney LK, Wilmore JH, Costil DL, ed., Physiology of Sport and Exercise. 5th ed. 2012, Human Kinetics: Champaign, IL. ↵
Brooks GA, Mercier J, Balance of carbohydrate and lipid utilizaiton during exercise: the "crossover" concept. Journal of Applied Physiology, 1994. 76(6): p. 2253-2261. ↵
Brooks GA, Mercier J, Balance of carbohydrate and lipid utilizaiton during exercise: the "crossover" concept. Journal of Applied Physiology, 1994. 76(6): p. 2253-2261. ↵
Boutellier U, Glezendanner D, Cerretelli P, and di Prampero PE, After effects of chronic hypoxia on VO2 kinetics and on O2 deficit and debt. Eur J Appl Physiol Occup Physiol, 1984. 53: p. 87-91. ↵
Powers SK, Dodd S, Beadle RE, Oxygen uptake kinetics in trained athletes differing in VO2max. Eur J Appl Physiol Occup Physiol, 1985. 54(3): p. 306-8. ↵
Powers SK, Dodd S, Beadle RE, Oxygen uptake kinetics in trained athletes differing in VO2max. Eur J Appl Physiol Occup Physiol, 1985. 54(3): p. 306-8. ↵
Powers SK, and Howley ET, Exercise Physiology (Theory and Application to Fitness and Performance). 9th Edition ed. 2015, New York, NY: McGraw-Hill ↵
Powers SK, and Howley ET, Exercise Physiology (Theory and Application to Fitness and Performance). 9th Edition ed. 2015, New York, NY: McGraw-Hill. 6. Busa WB, and Nuccitelli R, Metabolic regulation via intracellular pH. Am J Physiol Regul Integr Comp Physiol, 1984. 246: p. R409-R438. ↵
Powers SK, and Howley ET, Exercise Physiology (Theory and Application to Fitness and Performance). 9th Edition ed. 2015, New York, NY: McGraw-Hill. 6. Busa WB, and Nuccitelli R, Metabolic regulation via intracellular pH. Am J Physiol Regul Integr Comp Physiol, 1984. 246: p. R409-R438. ↵
Powers SK, and Howley ET, Exercise Physiology (Theory and Application to Fitness and Performance). 9th Edition ed. 2015, New York, NY: McGraw-Hill. 6. Busa WB, and Nuccitelli R, Metabolic regulation via intracellular pH. Am J Physiol Regul Integr Comp Physiol, 1984. 246: p. R409-R438. ↵
Hurley BF, Nemeth PM, Hagberg M, Dalsky GP, Martin III WH, and Holloszy JO. Muscle triglyceride utilization during exercise: effect of training. JAP, 1986. 60(2): p. 562-567. ↵
Weiss M, Newman A, Whitmore C, Weiss S. One hundred and fifty years of sprint and distance running – Past trends and future prospects. European Journal of Sport Science, 2016. 16 (4): p. 393-401. ↵
definition
The decline in the ability of a muscle to generate force or power during sustained or repeated activity. It is a complex, multifactorial phenomenon involving both peripheral and central mechanisms.
Decline in muscle performance caused by processes occurring within the muscle fibers themselves, rather than in the nervous system. It is a major component of overall muscle fatigue and is typically associated with metabolic and ionic changes during intense or prolonged exercise.
The reduction in voluntary muscle activation caused by processes within the central nervous system (CNS), rather than within the muscle itself. It limits the ability to fully recruit motor units during sustained or intense exercise.
A physiological condition characterized by an excessive accumulation of hydrogen ions (H⁺) in body fluids, leading to a decrease in blood pH below the normal range (7.35–7.45).
The maximum rate at which an individual can consume oxygen during intense, whole-body exercise, expressed in liters per minute (L/min) or milliliters per kilogram of body weight per minute (mL·kg⁻¹·min⁻¹). It reflects the integrated capacity of the cardiovascular, respiratory, and muscular systems to deliver and utilize oxygen for energy production.
The exercise intensity at which blood lactate concentration begins to rise significantly above resting levels, typically around 2–4 mmol·L⁻¹. It represents the point where lactate production exceeds clearance, signaling a shift toward greater reliance on anaerobic metabolism.
The exercise intensity at which blood lactate concentration reaches approximately 4 mmol·L⁻¹, marking a significant shift toward anaerobic metabolism.
The process of generating energy (ATP) without the use of oxygen, primarily through the breakdown of glucose or glycogen.
The exercise intensity at which ventilation (breathing rate and volume) increases disproportionately to oxygen uptake (VO₂). This occurs because carbon dioxide (CO₂) production rises sharply due to increased buffering of hydrogen ions (H⁺), signaling a greater reliance on anaerobic metabolism.
The rate at which the body consumes oxygen during rest or exercise, expressed in liters per minute (L/min) or milliliters per kilogram of body weight per minute (mL·kg⁻¹·min⁻¹).
The condition during submaximal, constant-load exercise where oxygen uptake (VO₂) plateaus and remains stable, indicating that aerobic energy supply meets the energy demand of the activity.
The gradual increase in oxygen uptake (VO₂) during prolonged, steady-state exercise at a constant submaximal workload, typically observed after 10–15 minutes of exercise, even though the external workload remains unchanged.
The difference between the oxygen required for a given exercise intensity and the actual oxygen uptake (VO₂) during the initial phase of exercise. It occurs because mitochondrial respiration takes time to fully activate, so energy demand is temporarily met by anaerobic pathways (ATP-PC system and anaerobic glycolysis).
(Now more commonly referred to as Excess Post-Exercise Oxygen Consumption, EPOC) is the elevated oxygen uptake that persists after exercise has ended, compared to resting levels. It represents the body’s effort to restore homeostasis and repay the “oxygen deficit” incurred at the start of exercise.
The elevated oxygen uptake that persists after exercise has ended, compared to resting levels. It reflects the body’s effort to restore physiological balance and recover from the metabolic stress of exercise.
The relative exercise intensity expressed as a percentage of an individual’s VO₂max.
The relative load used in resistance training expressed as a percentage of the maximum weight an individual can lift for one complete repetition of a given exercise (1RM).
A principle of exercise training that involves gradually increasing the stress placed on the body’s musculoskeletal and cardiovascular systems to stimulate adaptation and improve performance.
The process of generating ATP (energy) through the oxidation of carbohydrates, fats, and, to a lesser extent, proteins in the presence of oxygen.
(Also called slow-twitch fibers) are skeletal muscle fibers specialized for endurance and continuous, low-intensity activity. They rely primarily on aerobic metabolism for ATP production and are highly resistant to fatigue.
An increase in the size of skeletal muscle fibers resulting from resistance training or other stimuli that promote protein synthesis and muscle growth. Hypertrophy occurs primarily through the enlargement of individual muscle fibers rather than an increase in fiber number.
A small, oxygen-binding protein found primarily in muscle tissue. Myoglobin stores and facilitates the transport of oxygen within muscle cells, enabling sustained energy production during periods of high metabolic demand. It consists of a single polypeptide chain and a heme group that binds oxygen molecules.