Describe the primary functions of the cardiovascular system and explain how it responds to the increased demands of exercise.
Identify the structural components of the heart, including the atria, ventricles, and major valves, and describe their roles in the cardiac cycle.
Explain the Frank-Starling mechanism and its significance in regulating stroke volume and cardiac output during exercise.
Discuss the factors that influence cardiac output, including venous return, ventricular contractility, and total peripheral resistance.
Interpret an electrocardiogram (ECG), identifying key waveforms (P wave, QRS complex, T wave) and intervals (PR interval, ST segment, QT interval), and explain their significance in diagnosing cardiac conditions.
Analyze the changes in blood flow distribution during exercise and explain how the body prioritizes oxygen delivery to active muscles.
Describe the chronic cardiovascular adaptations that occur with regular aerobic training, including changes in heart size, stroke volume, and blood volume.
Explain the concept of heart rate variability (HRV) and its importance as an indicator of autonomic balance and cardiovascular health.
Apply the Fick equation to understand the relationship between cardiac output, oxygen delivery, and oxygen consumption during exercise.
Evaluate the impact of endurance training on resting and submaximal heart rates, and discuss the physiological mechanisms behind these changes.
Introduction
In this chapter, we will explore the heart and circulatory system’s response to exercise. Endurance exercise training induces significant adaptations in the cardiovascular system, enhancing performance, longevity, and overall cardiovascular function. These adaptations in the muscles, along with improvements in the oxygen transport system, boost the capacity for oxidative phosphorylation, thereby improving endurance performance. A major challenge to homeostasis during exercise is the increased muscular demand for oxygen, which can rise by 15 to 25 times during intense activity. The cardiovascular system responds through a complex mechanism that ultimately increases cardiac output and redistributes blood flow to the working muscles.
To fully understand the cardiovascular system’s response to exercise, it is essential to grasp the fundamentals of resting cardiac function. This chapter will cover the basic functions of the cardiovascular system, the cardiac cycle, and the cardiac conduction system. Additionally, we will introduce the electrocardiogram (ECG) and discuss some clinical measures of cardiac function. Finally, we will examine the cardiovascular adaptations and responses to exercise.
Basic Functions of the Cardiovascular System
The cardiovascular system’s primary function is to transport oxygen and nutrients to tissues and remove waste products. Additionally, it plays a crucial role in regulating body temperature. The circulatory and respiratory systems work together as an integrated unit, commonly referred to as the “cardiorespiratory system.” Detailed information about the respiratory system will be provided in Chapter 10.
Figure 9.1 The human cardiovascular system.
The heart, as illustrated in Figure 9.1, functions as two distinct pumps: the right heart, which circulates blood through the lungs, and the left heart, which circulates blood through the rest of the body. Each side of the heart operates as a pulsatile two-chamber pump, consisting of a superior atrium and an inferior ventricle. The atria serve as weaker pumps that deliver blood to the ventricles. The ventricles then provide the primary pumping force, propelling blood through the pulmonary circuit via the right ventricle, or through the systemic circuit via the left ventricle.
The human circulatory system operates as a closed circuit, circulating blood to all body tissues. This circulation requires a driving force to generate pressure, enabling blood to move through the body’s vessels. Since these vessels are continuous, the system is termed “closed.”
Arteriesare vessels that transport blood away from the heart, branching into smaller microscopic vessels called arterioles. Arterioles further develop into networks of even smaller vessels known as capillaries. Capillaries form extensive networks where the exchange of nutrients, including oxygen (O₂) and carbon dioxide (CO₂), occurs with the tissues (see Figure 9.2).
Figure 9.2 A capillary bed and it’s relationship to adjoining artery and vein.
At rest, some muscle capillaries have minimal or no blood flow. However, during strenuous exercise, the number of open capillaries increases two- to three-fold compared to the resting state[1]. This opening of dormant capillaries reduces the distance that oxygen and other nutrients must diffuse through.
Blood transitions from capillaries into small vessels called venules, which carry blood back toward the heart. Venules converge into larger veins that return blood to the heart. Major veins from both the upper and lower body empty directly into the heart. Due to the mixture of venous blood from the entire body, the blood returning to the right side of the heart is referred to as mixed venous blood[2].
Figure 9.3 Red blood cells inside a blood vessel.
Blood is a crucial component of the cardiovascular system, serving as the vehicle for transporting gases and nutrients. It is primarily composed of plasma, the fluid portion, and cells. Red blood cells (RBCs) are particularly important for gas transport. RBCs have a lifespan of four months and typically constitute 42% of blood in healthy college-aged males and 38% in females. Unique in their lack of a nucleus and mitochondria, RBCs have minimal metabolic needs and derive their energy mainly from glycolysis. Each RBC contains approximately 250 million hemoglobin (Hb) molecules, which are oxygen-carrying proteins. Each hemoglobin molecule has four sites that bind oxygen, and when all sites are occupied, the RBC is considered saturated. This means that each saturated RBC can bind approximately one billion oxygen molecules.
Structure of the Heart
The heart functions as a two-pump system that circulates blood through the lungs and the rest of the body by generating pressure. It has four chambers: two upper chambers called atria and two lower chambers called ventricles (see Figure 9.4). The right atrium and right ventricle form the right pump, while the left atrium and left ventricle form the left pump. The right and left sides of the heart are separated by a muscular wall called the interventricular septum, which prevents the mixing of blood between the two sides.
Figure 9.4 A cross-sectional view of anterior structures of the heart.
Blood moves from the atria to the ventricles through one-way valves called atrioventricular (AV) valves. These valves, shown in Figure 9.4, include the tricuspid valve (right AV valve) and the mitral valve (left AV valve, also known as the bicuspid valve). Blood then moves from the ventricles to the lungs via the pulmonary semilunar valve and from the ventricles to the aorta via the aortic semilunar valve. These semilunar valves prevent the backflow of blood within the heart and from the pulmonary artery and aorta.
Blood Flow Through the Heart
The right side of the heart pumps deoxygenated blood to the lungs through the pulmonary circuit, while the left side pumps oxygenated blood to the systemic circuit. Blood moves along a pressure gradient, flowing from higher to lower pressures. This pressure differential causes the heart valves to open and close, facilitating the movement of blood from one chamber to the next. The pathway of blood flow through the body is as follows:
Blood that has circulated through the body, delivering oxygen and nutrients and collecting waste products, returns to the heart through small venules that branch into larger veins. These veins converge into the great veins, the inferior and superior vena cava, which empty blood into the right atrium. When the blood pressure in the right atrium exceeds that in the right ventricle, blood flows from the right atrium through the tricuspid valve into the right ventricle. The right ventricle then pumps partially deoxygenated blood through the pulmonary semilunar valve into the pulmonary artery and onward to the lungs.
Figure 9.5 The pathway of blood flow throughout the body is a dual system which includes pulmonary and systemic circulation circuits.
In the lungs, external respiration occurs as oxygen is loaded onto red blood cells and carbon dioxide is unloaded. The oxygenated blood returns to the left atrium via the pulmonary veins. When the pressure in the left atrium exceeds that in the left ventricle, blood moves through the mitral valve into the left ventricle. The left ventricle then ejects the blood through the aortic semilunar valve into the systemic circulation. The oxygenated blood travels through the aorta into smaller arteries, which branch into arterioles and eventually reach the capillary beds in the tissues. Here, oxygen is unloaded from the blood to the tissues, and carbon dioxide is loaded into the blood in a process known as internal respiration. As a closed circuit, the deoxygenated blood is then returned to the right side of the heart via the venous system.
Figure 9.5 illustrates the pathway of blood flow through the heart and the systemic vessels of the upper and lower body. During exercise, blood flow increases in proportion to the metabolic needs of the muscles.
Myocardium
The heart walls are composed of three distinct layers: 1) the epicardium, 2) the myocardium, and 3) the endocardium. The outermost layer is the epicardium, a serous membrane that acts as a lubricative outer covering of the heart, containing blood capillaries, lymph capillaries, and nerve fibers. The next layer is the myocardium, which is responsible for the muscular contractions that eject blood from the heart. This layer is separated from the others by connective tissue and also contains blood capillaries, lymph capillaries, and nerve fibers. The innermost layer is the endocardium, which serves as the protective inner lining of the chambers and valves. The endocardium is composed of endothelial tissue and includes a thick layer of elastic and collagenous fibers that allow for stretch (see Figure 9.6).
Figure 9.6 The heart wall is composed of three distinct layers: the epicardium, the myocardium, and the endocardium. External to the epicardium are the pericardial cavity, serous pericardium, and the fibrous pericardium.
Cardiac muscle, collectively known as the myocardium, is striated and contains the same contractile proteins as skeletal muscle: actin and myosin. Despite its striated appearance, cardiac muscle differs from skeletal muscle in several ways. Firstly, cardiac muscle fibers are shorter than skeletal muscle fibers and are typically branched[3]. Anatomically, individual cardiac muscle fibers are interconnected end-to-end by regions called intercalated disks (see Figure 9.7). These disks contain desmosomes, which are protein structures that anchor neighboring cells together. The myocardium also features gap junctions, allowing for the rapid transmission of action potentials that signal the heart to contract as a single unit. Unlike skeletal muscle, cardiac muscle has only one fiber type, which is similar to type I fibers in that it is highly aerobic, contains a large number of mitochondria, and has a high capillary density[4].
Figure 9.7 Cardiac muscle fibers are continuous and are connected end to end with other cells through intercalated discs. Specialized proteins called desmosomes anchor two neighboring cells together so that they stay connected during contraction of the myocardium.
The thickness of the myocardium varies throughout the heart, depending on the amount of stress placed on it. The myocardium in the left ventricle is the thickest because it must generate sufficient pressure to pump blood throughout the entire body. This hypertrophy results from the pressure placed on the left ventricle at rest or under normal conditions of moderate activity. During vigorous aerobic activity, the demand on the left ventricle to deliver blood to the exercising muscles increases significantly, causing the left ventricle to hypertrophy.
Hypertrophy of the left ventricle can also result from diseases such as high blood pressure or valvular heart disease. Whether due to exercise training or disease, the myocardium adapts to the condition.
Figure 9.8 The anterior structures of the superficial heart and the associated blood vessels.
The myocardium has its own blood supply, receiving blood via the right and left coronary arteries (see Figure 9.8). Maintaining a constant blood supply to the heart is critical, as deficits in coronary blood flow result in myocardial damage. The heart has a high demand for oxygen and nutrients, and when coronary blood flow is disrupted for more than several minutes, permanent damage to the heart occurs. Unlike skeletal muscle fibers, cardiac muscle fibers do not regenerate because they lack satellite cells, giving heart muscle cells limited regenerative capacity.
Deficits in oxygen due to blockage of coronary blood vessels result in the death of cardiac muscle cells, commonly known as a heart attack or myocardial infarction. Damage to a significant portion of the myocardium greatly diminishes the heart’s pumping capacity, making it crucial to minimize injury during a heart attack. Strong evidence indicates that exercise training can provide cardiac protection during a heart attack[5].
Lastly, blood returning from the myocardium drains into the coronary sinus (see Figure 9.11) via the veins of the heart and the great coronary vein. This blood then empties into the right atrium as mixed venous blood.
Figure 9.9 The posterior structures of the superficial heart.
The Cardiac Cycle
The cardiac cycle encompasses all the events of a single heartbeat, characterized by a repeating pattern of contraction and relaxation of the heart. There are two primary phases of heart function: relaxation, known as diastole, and contraction, known as systole. During diastole, the heart fills with blood, while systole refers to the period when blood is ejected from the ventricles. These terms can describe the relaxation or contraction of the ventricles, but the atria also undergo systole and diastole. The heart’s two-step pumping action allows both atria to contract simultaneously, emptying arterial blood into the ventricles. Approximately 0.1 seconds later, both ventricles contract simultaneously, delivering blood to the systemic and pulmonary circuits.
Figure 9.10 The cardiac cycle illustrates all the events of a single heart beat and their corresponding ECG tracings.
The cardiac cycle can be divided into three phases, beginning in mid-to-late diastole, as shown in Figure 9.10. During the first phase, the ventricles fill with blood as the pressure from the atria overcomes the pressure in the ventricles, forcing the atrioventricular valves to open. An atrial contraction then pushes additional blood into the ventricles.
Systole begins in phase two and consists of two periods. The first period is isovolumetric contraction, where the blood volume in the ventricles remains constant, but the pressure builds. During this time, both the atrioventricular and semilunar valves are closed. In the second period of systole, ventricular ejection occurs, forcing the semilunar valves to open while the atrioventricular valves remain closed. Blood is then ejected to the body and lungs.
Phase three is isovolumetric relaxation, occurring during early diastole. At this time, both the atrioventricular and semilunar valves are closed, and the atria begin filling with blood.
Pressure Changes During the Cardiac Cycle
During the cardiac cycle, the pressure within the heart chambers fluctuates. When the atria are in diastole, blood flows into them from venous return. As the atria fill, the internal pressure gradually increases. Approximately 70% of the blood entering the atria during diastole flows directly into the ventricles through the atrioventricular valves before the atria contract. Upon atrial contraction, atrial pressure rises, forcing the remaining 30% of the blood into the ventricles.
A Wiggers diagram, shown in Figure 9.11, illustrates the changes in atrial pressure, ventricular pressure, and aortic pressure throughout the cardiac cycle.
Figure 9.11 A Wiggers diagram, showing the pressure changes during cardiac cycle events. The heart sounds from a phonocardiogram are also shown. The sound labeled 1st contributes to the S1 heart sound and is the reverberation of blood from the sudden closure of the mitral valve and the 2nd contributes to the S2 heart sound and is the reverberation of blood from the sudden closure of the aortic semilunar valve.
Recall that pressure is the most important factor in blood flow through the heart and systemic circulation. As expected, the pressure in the ventricles is low while they are filling. However, when the atria contract, the ventricular pressure increases slightly. As the ventricles contract, the pressure rises sharply, closing the atrioventricular valves to prevent backflow of blood into the atria, as shown in the Wiggers diagram (see Figure 9.11). Once the ventricular pressure exceeds the pressure in the pulmonary artery and the aorta, the semilunar valves open, and blood is forced into both the pulmonary and systemic circuits. Heart sounds are heard as the heart valves close: the “lub” sound is the closing of the atrioventricular valves (first heart sound), and the “dub” sound is the closing of the semilunar valves (second heart sound).
Blood exerts pressure throughout the circulatory system, but it is greatest within the arteries. Blood pressure, the force exerted by the blood against the arterial walls, is generally measured as an indication of health. Blood pressure is influenced by the volume of blood pumped and the resistance to flow. A sphygmomanometer can estimate arterial blood pressure. Normal blood pressure for an adult male is 120/80 mmHg, while for an adult female it tends to be lower (110/70 mmHg). High blood pressure is diagnosed if the pressure is greater than 140/90 mmHg. The top number represents systolic blood pressure, the pressure in the arteries during ventricular contraction (systole). Diastolic blood pressure, the bottom number, is the pressure during cardiac relaxation (diastole). At maximal exercise capacity, systolic blood pressure increases, and diastolic pressure decreases. The difference between these pressures is called pulse pressure and can be calculated as follows:
Pulse pressure = SBP – DBP
The average pressure during a cardiac cycle is called mean arterial pressure (MAP). It is significant because it determines the rate of blood flow through the systemic circuit during rest. The mean arterial pressure is determined by the following equation:
Mean arterial pressure = DBP + 0.33(pulse pressure)
It is difficult to find the mean arterial pressure during exercise because the formula assumes that 33% of the total cardiac cycle is spent in systole. During exercise, systole may account for up to 66% of the cardiac cycle; therefore, the formula must be adjusted to reflect the time spent in systole and diastole [2].
The Cardiac Conduction System
At rest, specialized mechanisms in the heart cause a succession of heart contractions called cardiac rhythmicity. This intrinsic rhythm transmits action potentials throughout the heart muscle, causing the heart to beat at regular intervals. The heart is equipped with an electrical conduction system that generates and conducts electrical impulses from the atria to the ventricles. The electrical impulse follows specialized pathways, causing the atria and ventricles to contract at specific times. The system, illustrated in Figure 9.12, consists of the sinoatrial (SA) node, the interatrial tract (Bachmann’s bundle), the internodal tracts, the atrioventricular (AV) node, the bundle of His, the right and left bundle branches, and the Purkinje fibers[6].
Figure 9.12 The structures of the electrical conduction system of the heart.
The sinoatrial (SA) node, known as the pacemaker of the heart, discharges impulses in a rhythmic fashion at a rate of 60-100 beats per minute (bpm). It possesses the highest level of automaticity, or inherent firing rate. The atrioventricular (AV) node can function as a secondary pacemaker at a rate of 40-60 bpm. Additionally, ventricular pacemaker cells can fire at a rate of 30-40 bpm or less. If the SA node fails to generate electrical impulses at its normal rate or if the conduction of these impulses is blocked, pacemaker cells in other sites can assume control of the heart rate, albeit at a much slower rate[7].
The regular impulse sent by the SA node to the myocardium is called an intrinsic rhythm because the impulse originates from within the heart itself. As the impulse leaves the SA node, it is conducted via Bachmann’s bundles (interatrial tracts) through the left atrium and passes through internodal tracts down the right atrium. The impulse is then conducted to the AV node, located in the lower right atrium near the septum of the heart, where there is a momentary delay.
The AV node has three main functions. First, it slows the conduction of the electrical impulse to allow time for the atria to contract and empty blood into the ventricles, a process known as the atrial kick, which occurs before the ventricles contract. Secondly, the AV node blocks impulses from being conducted when the atrial rate is too rapid, protecting the ventricles from dangerously fast rates. Lastly, the AV node acts as a backup pacemaker if the SA node fails.
After the delay in the AV node, the impulse moves rapidly through the bundle of His, located in the septum region of the heart. The impulse then divides into two important conducting pathways: the right bundle branch (RBB) and the left bundle branch (LBB). Both bundle branches terminate in a network of terminal fibers called the Purkinje fibers. The signal then penetrates the ventricular muscle mass as the Purkinje fibers form an elaborate web of pathways[8].
Figure 9.13 An illustration of the heart’s electrical events; 1) Resting conditions, 2) SA node causes atria to begin depolarizing, 3) atrial depolarization, 4) depolarization delays at AV node and then quickly travels down the bundle of His, 5) depolarization spreads down LBB and RBB in the ventricles beginning at the apex and progresses superiorly as atria re-polarize, and 6) ventricular repolarization begins at the apex and also progresses superiorly.
Electrocardiogram (ECG)
The electrocardiogram (ECG) is a recording of the heart’s electrical activity. It captures the electrical processes of depolarization and repolarization in the myocardium. Depolarization refers to the spread of the electrical stimulus through the heart, while repolarization is the return of the stimulated muscle to its resting state. These electrical processes generate currents that are transmitted to the body’s surface and can be detected by electrodes attached to the skin.
The ECG allows for continuous observation of the heart’s electrical activity and is used to identify arrhythmias, evaluate pacemaker function, and assess the response to medications. Cardiologists often analyze the ECG during exercise to diagnose coronary artery disease.
Figure 9.14 Anterior view of monitor lead position in a typical 12-lead ECG.
To perform ECG monitoring, conductive gel pads (electrodes) are placed on the patient’s chest and body and connected to a lead-cable system. This setup allows the electric current to be displayed on a monitor screen (oscilloscope) and recorded on ECG graph paper. In a typical 12-lead ECG, there are six chest lead positions (V1 to V6), two arm positions (RA and LA), and two leg positions (LL and RL). Figure 9.14 shows the electrode positions for a typical 12-lead ECG.
A monitor lead, or ECG lead, provides a view of the heart’s electrical activity between two points and is recorded on specialized graph paper. As shown in Figure 9.15, the flat line represents the baseline of electrical current, known as the isoelectric line. Any waveform above the isoelectric line is considered a positive (upright) deflection, while any waveform below the isoelectric line is a negative (downward) deflection. A deflection with both positive and negative components, such as the QRS complex, is called a biphasic deflection. Biphasic deflections occur when current flowing away from the poles is detected. Electric currents traveling toward the positive pole produce a positive deflection, while currents flowing toward the negative pole result in a negative deflection.
The heart’s electrical activity is represented on the ECG tracing by three basic waveforms: the P wave, the QRS complex, and the T wave. Between these waveforms are segments and intervals, such as the PR interval, the ST segment, and the QT interval. Occasionally, a U wave is also present. These waves and intervals correspond to different phases of the cardiac conduction system.
Figure 9.15 An ECG tracing of one cardiac cycle.
P wave: Depicts atrial depolarization, which is the spread of the impulse from the SA node throughout the atria.
PR interval: Represents the time from the onset of atrial depolarization to the onset of ventricular depolarization.
QRS complex: Depicts the spread of the impulse through the ventricles, or ventricular depolarization. Note that atrial repolarization occurs simultaneously with ventricular depolarization and is masked by the QRS signal.
ST segment: Represents the end of ventricular depolarization and the beginning of ventricular repolarization.
T wave: Represents the latter phase of ventricular repolarization.
U wave: Although not always present, it is thought to represent further repolarization of the ventricles[9].
Figure 9.16 Relationship of the electrical conduction system to the ECG. Note that there are 2 cardiac cycles emphasized.
The PQRST sequence is recorded on special graph paper, as shown in Figure 9.16. Each small square measured horizontally represents 0.04 seconds in time. The distance of the R-R interval in Figure 9.16 extends across 20 small squares, representing 0.8 seconds (0.04 seconds x 20 squares). Each small square measured vertically indicates the voltage or amplitude in millimeters (mm)[10]. Each square represents 1 mm in height. Therefore, the height of the QRS complex, which spans 14 small squares, represents a voltage of 14 mm (1 mm x 14 squares).
Figure 9.17 The conduction system of the heart and the associated ECG tracings comparing a NSR (top) and sinus bradycardia (bottom).
The ECG is a valuable tool in clinical settings, providing a noninvasive means of assessing heart function. Abnormalities in the ECG can indicate coronary heart disease due to restricted blood flow to the tissues, or ischemia. For instance, ST segment depression may signal myocardial ischemia, while an elevated ST segment can indicate myocardial injury[11]. ECG monitoring is also effective in identifying cardiac arrhythmias. Heart rate, expressed as beats per minute (bpm), is a key metric. A normal sinus rhythm (NSR) describes a resting heart rate of 60-100 bpm. Sinus bradycardia is identified when a resting heart rate is less than 60 bpm, as illustrated in Figure 9.17. Conversely, sinus tachycardia is a resting heart rate over 100 bpm.
Heart Rate Regulation and Variability
Heart rate is regulated by the autonomic nervous system. It can be elevated by increasing sympathetic activity or decreasing parasympathetic (vagal) activity. Heart rate variability (HRV)refers to the variation in the time between heartbeats. This interval, measured in milliseconds, can be determined as the R-R interval on an ECG tracing, as shown in Figure 9.16. Although it may seem counterintuitive, a wide variation in HRV is considered a good indicator of health, reflecting a healthy balance between the sympathetic and parasympathetic nervous systems.
The physiological significance of HRV lies in its reflection of autonomic balance, making it an excellent noninvasive screening tool for many cardiovascular diseases. Low HRV has been shown to predict cardiovascular events, such as sudden cardiac death, and generally indicates an imbalance in autonomic regulation.
Terminology of Cardiac Function
Understanding the following measures of cardiac function is essential for discussing the heart’s responses to exercise:
End-Diastolic Volume (EDV): The volume of blood in the ventricles at the end of diastole, also known as the “preload.”
Stroke Volume (SV) is the difference between EDV and ESV: SV(ml/beat) = EDV – ESV
Ejection Fraction (EF) is an important clinical term used to assess the heart’s pumping ability. It describes the fraction, as a percentage, of blood pumped out of the ventricles relative to the amount of blood in the ventricle before contraction. EF is calculated by dividing the stroke volume by the end-diastolic volume: EF(%) = (SV/EDV) x 100
The average ejection fraction in a healthy adult is 60% at rest, meaning that 60% of the blood in the ventricles is ejected per beat.
Cardiac Output (Q) describes the total amount of blood pumped by the heart per minute. It is the product of heart rate and stroke volume: Q(L/min) = HR x SV
The abbreviation “Q” stands for the “quantity” of blood pumped per minute. The average cardiac output is 4.0 L/min in women and 5.6 L/min in men[12]. In round numbers, it is often stated to be approximately 5 L/min.
Factors Affecting Cardiac Output
During exercise, cardiac output increases proportionally to the metabolic needs of the muscles. Several factors influence cardiac output during exercise, including increased venous blood return, ventricular contractility, ventricular stretch, and resistance to blood flow. These factors are described below.
Exercise enhances blood return from the body through several mechanisms. Figure 9.18 illustrates the muscle pump, which results from the mechanical action of rhythmic skeletal muscle contractions during exercise. When muscles contract, they compress their veins, pushing blood back toward the heart. Veins contain one-way valves that prevent blood from flowing away from the heart. Between contractions, blood fills the veins, and the process repeats. This mechanism accelerates venous blood return, increasing end-diastolic volume (EDV), stroke volume, and cardiac output. However, if the returning blood exceeds the heart’s pumping capacity during exercise, the heart becomes the limiting factor for cardiac output.
Additionally, venoconstriction increases venous return by reducing the veins’ capacity to store blood, thereby moving blood back toward the heart. This occurs through reflex sympathetic constriction of smooth muscle in veins draining skeletal muscle. Endurance training has been shown to enhance venous blood return, thereby increasing EDV.
Figure 9.18 The muscle pump. The action of the one-way venous valves imbedded in skeletal muscle ensure the unidirectional flow of blood back to the heart. Contractions of the skeletal muscles help to pump blood toward the heart, preventing blood from flowing away from the heart or pooling in the lower extremities due to gravity.
Venous blood return is the primary controller of cardiac output and is more important than the heart itself in controlling cardiac output [1]. This is because the heart has a built-in mechanism that allows it to pump automatically whatever amount of blood flows into the right atrium from the veins. This mechanism is called the Frank-Starling lawof the heart. Essentially, when increased quantities of blood flow into the heart and stretch the walls of the heart chambers, the Frank-Starling mechanism is triggered. As a result, the cardiac muscle contracts with increased force. Like any other muscle, the myocardium can contract with greater force, known as ventricular contractility, which directly affects stroke volume. Therefore, the Frank-Starling mechanism leads to a more powerful ventricular contraction, emptying the extra blood that has returned from systemic circulation. This amount of blood return from the body is also referred to as the “preload.”
Cardiac output levels also vary with changes in total peripheral resistance, especially long-term levels. To eject blood, the pressure generated by the left ventricle must exceed the pressure in the aorta. Therefore, aortic pressure or mean arterial pressure (called afterload) represents a barrier to the ejection of blood and cardiac output. Total peripheral resistance from smaller openings or diseased vessels greatly affects cardiac output. This can be understood by considering Ohm’s law: Q = arterial pressure/total peripheral resistance
The meaning of this formula is that any time the level of total peripheral resistance changes, the cardiac output changes quantitatively in the opposite direction. Aortic and pulmonary artery resistance to blood flow can adversely affect cardiac output. Healthy arteries have better vasodilation, allowing blood to travel more efficiently through the systemic circuit. Maintenance of normal arterial pressure usually occurs via nervous reflexes and is essential to achieving high cardiac outputs during exercise when the muscles dilate their vessels to increase blood flow and venous return[13]. It is noteworthy that afterload is minimized during exercise due to arteriole dilation. The arteriole dilation in working muscles decreases aortic pressure, making it easier for the heart to pump large volumes of blood[14].
The final factor influencing cardiac output is the effect of circulating epinephrine and norepinephrine (catecholamines). In addition to increases in sympathetic nervous system stimulation, catecholamines increase muscle contractility by increasing the amount of calcium available to the myocardial cells. As you may recall, calcium is necessary for muscle contraction activation. Calcium release into the muscle cell increases cross-bridge activation and force production.
In summary, cardiac output is regulated by venous blood return (EDV), cardiac contractility, and cardiac afterload. During upright exercise, there is an increase in EDV, contractility, and cardiac output due to the rhythmic mechanical contraction of skeletal muscles and influence from the nervous system. Catecholamines also play a role in increasing contractility and cardiac output during exercise.
Cardiovascular Responses to Exercise
Improvements in endurance resulting from regular aerobic training, such as running and swimming, stem from multiple adaptations to the training stimulus. Aerobic training, or cardiorespiratory endurance training, enhances cardiac function and peripheral blood flow. It significantly boosts the capacity of muscle fibers to generate ATP, which is dependent on oxygen supplied and transported via the cardiovascular system.
During maximal exercise, the metabolic need for oxygen in skeletal muscle can increase up to 25 times the resting values. Increased oxygen delivery to exercising skeletal muscle is achieved by 1) increasing cardiac output and 2) redistributing blood flow from inactive organs to the working muscles. Blood is also directed away from the gut by decreasing blood flow to the splanchnic area (i.e., liver, kidneys, GI tract). These mechanisms are facilitated by the cardiorespiratory system.
Cardiac output and blood flow increase in direct proportion to the metabolic requirements of the tissues. At rest, approximately 15% to 20% of total cardiac output is directed toward skeletal muscle. However, during maximal exercise, 80% to 85% of total cardiac output goes to contracting skeletal muscle [5]. Increased blood flow allows more oxygen delivery to the working skeletal muscles, achieved by increasing arteriole vasodilation in vessels supplying the muscles. During heavy exercise, the percentage of blood going to the brain is reduced compared to the percentage at rest, but the absolute blood flow to the brain is slightly increased above resting values, thus improving blood flow to the brain. Additionally, total coronary blood flow increases during heavy exercise due to increased cardiac output, supplying the myocardium with enough oxygen to meet the demands of increased contraction necessary to amplify heart rate. Both light and moderate intensities of exercise increase blood flow to the skin, but this decreases during maximal exercise. Finally, compared to resting values, blood flow to abdominal organs decreases during maximal exercise. Increases in muscle blood flow during exercise and the decrease in splanchnic blood flow change as a linear function of %VO2max [5].
To utilize the oxygen delivered by the cardiovascular system, there must also be changes in oxygen uptake by muscles during exercise. Oxygen uptake by muscles increases during exercise and can be measured by determining the arterial-(mixed blood) venous O2 difference (a-vO2 difference). The a-vO2 difference represents the amount of O2 taken up from 100 ml of blood by the tissues during one cycle of the systemic circuit. To find the a-vO2 difference, the change in O2 blood content between the arteries and veins is determined. During intense exercise, an increase in the a-vO2 difference indicates enhanced oxygen extraction at the muscle capillaries. This increase is due to a rise in the amount of O2 taken up and used for oxidative phosphorylation (i.e., utilization of O2 in skeletal muscle) by skeletal muscle. Endurance exercise training has been shown to increase muscles’ O2 extraction abilities.
Chronic Cardiovascular Adaptations to Aerobic Training
Multiple chronic cardiovascular adaptations occur in response to exercise training, including changes in heart size, cardiac output, blood volume, and others. To fully understand these changes, it is important to review how these components relate to oxygen transport. Much of endurance performance is related to the cardiovascular and respiratory systems’ ability to deliver sufficient oxygen to meet the needs of metabolically active muscles. The Fick equation (1870), developed by Adolf Eugene Fick, describes the relationship between oxygen delivery and utilization by the tissues with whole-body oxygen consumption. The product of cardiac output and the (a-v)O2 difference determines the rate at which oxygen is being consumed: VO2 = Q x (a – v)O2 difference
Cardiac muscle, like skeletal muscle, can undergo morphological changes when stimulated by exercise training. Cardiac hypertrophy of the left ventricle can be induced by exercise, resulting in an increase in chamber size. This allows for increased filling and, consequently, an increase in stroke volume and cardiac output. In concert with this, a decrease in heart rate at rest is caused by increased parasympathetic tone, and during exercise at the same rate of work, this adaptation allows a longer diastolic filling period. As mentioned, endurance training results in hypertrophy of the left ventricular wall, increasing its thickness. Increased ventricular mass results in increased contractile force, in turn causing a lower end-systolic volume (ESV). It was once thought that cardiac hypertrophy was dangerous because experts erroneously believed that enlargement of the heart always reflected a pathological state, as seen in cases of severe hypertension and myopathies. It is now known that endurance training-induced cardiac hypertrophy is a normal adaptation to chronic training and that left ventricular mass is highly correlated with VO2max and, therefore, improved performance[15].
Aerobic training affects stroke volume through adaptations to the left ventricular dimensions, increases in contractility, and a greater blood volume. Following a program of endurance training, stroke volume at rest is substantially higher than it was prior to training. This is known as a chronic adaptation. Stroke volume can be greatly affected by the volume of blood that enters the ventricle during diastole. Plasma volume has been shown to expand with training, increasing the end-diastolic volume (EDV). Additionally, an increase in red blood cell volume also contributes to the overall increase in blood volume, though this finding is inconsistent[16]. Although the actual number of red blood cells may increase, the hematocrit may decrease. Hematocrit is the ratio of red blood cell volume to total blood volume. A trained athlete’s hematocrit can decrease due to a greater increase in plasma volume. However, this may be beneficial. One physiological benefit of decreasing hematocrit is reduced blood viscosity, which decreases peripheral resistance to blood flow. Both increases in plasma and hematocrit result in more blood entering the ventricles. Recall that increased blood volumes stretch the ventricular walls, resulting in an increased force of contraction (i.e., the Frank-Starling mechanism). Therefore, if more blood enters the left ventricle, a greater percentage of it is ejected with each contraction with greater force, resulting in an increase in stroke volume.
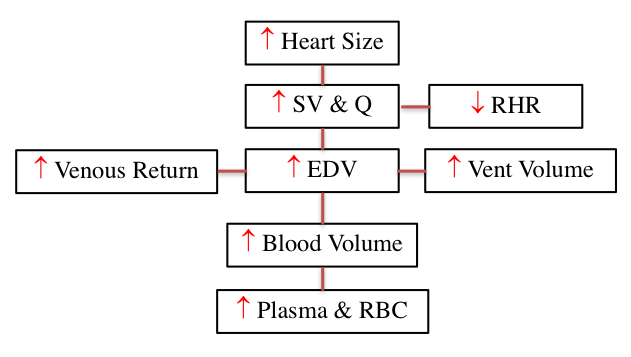
Figure 9.19 A flow chart of factors that increase cardiovascular endurance performance including heart size, stroke volume, cardiac output, resting heart rate, venous return, end diastolic volume, ventricular volume, blood volume, plasma and red blood cell content.
Studies have shown that a sedentary individual with an initial resting heart rate (RHR) of 80 bpm can decrease their resting heart rate by approximately 1 bpm per week of aerobic training, at least for the first few weeks. After 10 weeks of training, resting heart rate can decrease from 80 to 70 bpm or lower[17]. Similarly, after endurance training, submaximal heart rate is 10 to 20 bpm lower during exercise at the same absolute workload. This reflects increased cardiac output, higher stroke volumes, and increased blood volume, indicating that a trained heart performs less work than an untrained heart at the same workload. On the other hand, maximal heart rate generally does not change or may decrease slightly with endurance training. The mechanisms responsible for this decrease in RHR are not fully understood, but training appears to influence parasympathetic activity in the heart, while a decrease in sympathetic activity may play a small role.
In summary, blood flow to active muscles increases with endurance training due to several factors. Figure 9.19 summarizes the factors that enhance cardiovascular endurance performance. Increases in blood volume, stroke volume, ventricular muscle mass, and venous blood return ultimately result in increased cardiac output and a decreased resting heart rate. Endurance training programs improve the consumption, distribution, and utilization of oxygen within skeletal muscles, with the cardiorespiratory system adapting to the training stimulus to facilitate these developments.
Chapter Summary
This chapter explored the heart and circulatory system’s response to exercise, highlighting the significant adaptations that occur with endurance training. Key points include:
Cardiovascular Adaptations: Endurance exercise training enhances cardiac function and peripheral blood flow, increasing the capacity for oxidative phosphorylation and improving endurance performance. The cardiovascular system responds to increased muscular demand for oxygen by increasing cardiac output and redistributing blood flow to working muscles.
Heart Structure and Function: The heart functions as a two-pump system, with the right side pumping blood to the lungs and the left side pumping blood to the rest of the body. The myocardium, the heart’s muscular layer, adapts to exercise by increasing in thickness and contractile force, particularly in the left ventricle.
Blood Flow and Pressure: Blood flow through the heart and systemic circulation is driven by pressure changes. The cardiac cycle, consisting of systole and diastole, regulates the movement of blood through the heart’s chambers and valves. The ECG is a crucial tool for monitoring the heart’s electrical activity and diagnosing conditions such as arrhythmias and myocardial ischemia.
Cardiac Output: Cardiac output, the total amount of blood pumped by the heart per minute, is influenced by factors such as venous return, ventricular contractility, and resistance to blood flow. The Frank-Starling mechanism and the effects of catecholamines play significant roles in regulating cardiac output during exercise.
Chronic Adaptations: Regular aerobic training induces chronic cardiovascular adaptations, including increased heart size, stroke volume, and blood volume. These changes enhance the heart’s efficiency and capacity to meet the metabolic demands of active muscles. Endurance training also improves the body’s ability to extract and utilize oxygen, as reflected in increased a-vO2 difference.
Heart Rate and Blood Flow: Endurance training lowers resting and submaximal heart rates, reflecting improved cardiac efficiency. Blood flow to active muscles increases during exercise, facilitated by arteriole vasodilation and enhanced venous return. These adaptations support greater oxygen delivery and utilization during physical activity.
Overall, the chapter emphasized the intricate relationship between the cardiovascular system and exercise, detailing how regular aerobic training leads to significant improvements in cardiovascular health and performance.
Scholarly Questions
What are the three primary functions of the cardiovascular system?
Define the following terms: arteries, arterioles, capillaries, veins, venules, hemoglobin, epicardium, myocardium, endocardium, and pericardium.
Trace the pathway of blood flow through the body, starting with blood returning in the venules.
What are the two phases of the cardiac cycle? Describe which valves are open and closed during each phase.
Trace the cardiac conduction system from the SA node to the Purkinje fibers. Where is the SA node located? What is the term for the heart’s ability to generate its own electrical signal?
How do the chordae tendineae prevent backflow of blood into the atria?
Identify the major components of the ECG. What occurs during each wave?
What is the range for normal sinus rhythm? Define sinus bradycardia and sinus tachycardia.
Which part of the nervous system plays the largest role in decreasing resting heart rate (RHR)?
What is a normal stroke volume in milliliters?
Define the following terms: end-diastolic volume, end-systolic volume, stroke volume, cardiac output, contractility, systolic blood pressure, diastolic blood pressure, and ejection fraction.
What are the unique metabolic needs of red blood cells? Why is this important for oxygen transportation?
Describe the heart rate response to exercise. Is there an anticipatory response, and what causes it?
Which is better for predicting exercise intensity, heart rate or VO2? Explain why.
Discuss the factors that affect stroke volume.
How is blood redirected during exercise?
List some cardiovascular adaptations that occur with endurance training.
How does exercise affect blood pressure?
What is the arterial-(mixed) venous O2 difference? What does it represent?
What is the Fick equation?
What causes the heart sounds?
Which valves are open or closed when pressure in the ventricles is greatest?
Guyton AC, and Hall JE, Textbook of Medical Physiology. 11th ed. 2006, Philadelphia, PA: Elsevier Saunders. ↵
Powers SK, and Howley ET, Exercise Physiology (Theory and Application to Fitness and Performance). 9th Edition ed. 2015, New York, NY: McGraw-Hill. ↵
Powers SK, and Howley ET, Exercise Physiology (Theory and Application to Fitness and Performance). 9th Edition ed. 2015, New York, NY: McGraw-Hill. ↵
Kenney WL, Wilmore JH, Costil DL, ed. Physiology of Sport and Exercise. 5th ed. 2012, Human Kinetics: Champaign, IL. ↵
Powers SK, and Howley ET, Exercise Physiology (Theory and Application to Fitness and Performance). 9th Edition ed. 2015, New York, NY: McGraw-Hill. ↵
Huff J, ECG workout: exercises in arrhythmia interpretation. Fifth ed. 2006, Philadelphia, PA: Lippincott Williams & Wilkins. ↵
Huff J, ECG workout: exercises in arrhythmia interpretation. Fifth ed. 2006, Philadelphia, PA: Lippincott Williams & Wilkins. ↵
Huff J, ECG workout: exercises in arrhythmia interpretation. Fifth ed. 2006, Philadelphia, PA: Lippincott Williams & Wilkins. ↵
Huff J, ECG workout: exercises in arrhythmia interpretation. Fifth ed. 2006, Philadelphia, PA: Lippincott Williams & Wilkins. ↵
Huff J, ECG workout: exercises in arrhythmia interpretation. Fifth ed. 2006, Philadelphia, PA: Lippincott Williams & Wilkins. ↵
Huff J, ECG workout: exercises in arrhythmia interpretation. Fifth ed. 2006, Philadelphia, PA: Lippincott Williams & Wilkins. ↵
Guyton AC, and Hall JE, Textbook of Medical Physiology. 11th ed. 2006, Philadelphia, PA: Elsevier Saunders. ↵
Guyton AC, and Hall JE, Textbook of Medical Physiology. 11th ed. 2006, Philadelphia, PA: Elsevier Saunders. ↵
Powers SK, and Howley ET, Exercise Physiology (Theory and Application to Fitness and Performance). 9th Edition ed. 2015, New York, NY: McGraw-Hill. ↵
Milliken MC, Stray-Gundersen J, Left ventricular mass as determined by magnetic resonance imaging in male endurance athletes. American Journal of Cardiology, 1988. 62: p. 301-305. ↵
Kenney WL, Wilmore JH, Costil DL, ed. Physiology of Sport and Exercise. 5th ed. 2012, Human Kinetics: Champaign, IL. ↵
Kenney WL, Wilmore JH, Costil DL, ed. Physiology of Sport and Exercise. 5th ed. 2012, Human Kinetics: Champaign, IL. ↵
definition
Blood vessels that carry oxygenated blood away from the heart to the tissues and organs of the body. They have thick, elastic walls composed of three layers (tunica intima, tunica media, and tunica externa) that allow them to withstand and regulate high blood pressure generated by the heart’s contractions.
Small-diameter blood vessels that branch from arteries and lead to capillaries. They play a critical role in regulating blood flow and blood pressure by adjusting their diameter through vasoconstriction and vasodilation, which control resistance within the circulatory system.
The smallest and thinnest blood vessels in the circulatory system, forming networks that connect arterioles to venules. Their walls consist of a single layer of endothelial cells, allowing efficient exchange of gases, nutrients, and waste products between blood and surrounding tissues.
Small blood vessels that collect blood from capillary beds and transport it to veins. Venules have thin walls composed of endothelium and a small amount of smooth muscle, allowing them to facilitate the exchange of some substances and serve as a transition point between the microcirculation and the larger venous system.
Blood vessels that carry blood toward the heart, typically deoxygenated (except in pulmonary and umbilical veins). Veins have thinner walls and larger lumens than arteries, and they contain valves that prevent backflow of blood, aiding its return to the heart under low pressure.
Heart valves located between the atria and ventricles that prevent backflow of blood into the atria during ventricular contraction. There are two AV valves: the tricuspid valve on the right side of the heart and the bicuspid (mitral) valve on the left side.
Heart valves located at the bases of the large arteries leaving the ventricles—the aortic valve and the pulmonary valve. They prevent backflow of blood into the ventricles after ventricular contraction.
The outermost layer of the heart wall, forming part of the pericardium. It consists of a thin layer of connective tissue and fat covered by mesothelium, providing a protective layer and reducing friction between the heart and surrounding structures during contraction.
The thick, muscular middle layer of the heart wall composed primarily of cardiac muscle tissue. It is responsible for the contractile force that pumps blood throughout the body. The myocardium varies in thickness, being thickest in the left ventricle to generate the high pressure needed for systemic circulation.
The innermost layer of the heart wall, composed of a thin layer of endothelial cells and connective tissue. It lines the heart chambers and covers the heart valves, providing a smooth surface that minimizes friction and reduces the risk of blood clot formation during cardiac function.
Specialized junctions between cardiac muscle cells that contain desmosomes and gap junctions. These structures provide strong mechanical attachment and allow electrical impulses to pass rapidly between cells, enabling the heart muscle to contract as a coordinated unit (functional syncytium).
The sequence of mechanical and electrical events that occur during one complete heartbeat, including atrial contraction (atrial systole), ventricular contraction (ventricular systole), and relaxation of all chambers (diastole).
The phase of the cardiac cycle during which the heart muscle relaxes after contraction, allowing the chambers (atria and ventricles) to fill with blood.
The phase of the cardiac cycle during which the heart muscle contracts, causing the ventricles (and to a lesser extent the atria) to eject blood into the arteries.
The force exerted by circulating blood on the walls of blood vessels, typically measured in the arteries.
The difference between systolic and diastolic blood pressure. It reflects the force the heart generates with each contraction and is an indicator of arterial compliance. Normal pulse pressure is typically around 40 mmHg in healthy adults.
The average pressure in a patient’s arteries during one cardiac cycle. It represents the perfusion pressure delivered to organs and tissues.
A specialized cluster of pacemaker cells located in the right atrium of the heart that initiates electrical impulses, setting the rhythm for the heartbeat. The SA node generates action potentials that spread through the atria, causing atrial contraction and establishing the heart’s intrinsic rate, typically 60–100 beats per minute in adults.
A cluster of specialized cardiac cells located in the interatrial septum near the tricuspid valve. The AV node receives electrical impulses from the sinoatrial (SA) node and delays them briefly before transmitting them to the bundle of His and Purkinje fibers. This delay ensures that the atria contract and empty blood into the ventricles before ventricular contraction begins.
A specialized group of cardiac muscle fibers located in the interventricular septum that conducts electrical impulses from the atrioventricular (AV) node to the right and left bundle branches. The bundle of His is a critical component of the heart’s conduction system, ensuring that the ventricles receive the signal to contract after the atria have contracted.
One of the two main pathways (right and left bundle branches) that conduct electrical impulses from the atrioventricular (AV) bundle (bundle of His) down the interventricular septum toward the Purkinje fibers. These branches ensure coordinated contraction of the right and left ventricles by rapidly transmitting the action potential to the ventricular myocardium.
Specialized conductive fibers located in the inner ventricular walls of the heart. They rapidly transmit electrical impulses from the bundle branches to the ventricular myocardium, ensuring a coordinated and efficient contraction of both ventricles during systole.
A diagnostic test that records the electrical activity of the heart over time using electrodes placed on the skin. The ECG produces a waveform with characteristic components (P wave, QRS complex, and T wave) that represent atrial depolarization, ventricular depolarization, and ventricular repolarization, respectively. It is commonly used to assess heart rhythm, detect arrhythmias, and evaluate cardiac health.
A phase in which the membrane potential of a cell becomes less negative (moves toward zero) compared to the resting membrane potential.
The process by which the membrane potential of a cell returns to its resting negative value after depolarization. In neurons and muscle cells, repolarization occurs primarily when voltage-gated potassium (K⁺) channels open, allowing K⁺ ions to exit the cell, restoring the negative internal environment.
The first deflection on an electrocardiogram (ECG) representing atrial depolarization, which triggers atrial contraction. It reflects the electrical activity as the impulse originates in the sinoatrial (SA) node and spreads through the atria.
A series of deflections on an electrocardiogram (ECG) representing ventricular depolarization, which triggers ventricular contraction. It typically consists of a small downward deflection (Q), a large upward spike (R), and a subsequent downward deflection (S).
The deflection on an electrocardiogram (ECG) that represents ventricular repolarization, the process by which the ventricles recover electrically after contraction. It follows the QRS complex and precedes the next cardiac cycle.
The time interval on an electrocardiogram (ECG) from the beginning of the P wave to the start of the QRS complex. It represents the period of atrial depolarization and the delay in the atrioventricular (AV) node before ventricular depolarization begins. Normal duration is typically 0.12–0.20 seconds.
The flat section of the ECG tracing between the end of the QRS complex and the beginning of the T wave. It represents the period when the ventricles are depolarized and in the early phase of repolarization. Abnormalities in the ST segment can indicate myocardial ischemia or infarction.
The time interval from the start of the QRS complex to the end of the T wave on an ECG. It represents the total time for ventricular depolarization and repolarization. The QT interval varies with heart rate and is clinically important for detecting arrhythmia risk.
A small, rounded deflection on an electrocardiogram (ECG) that follows the T wave and precedes the next P wave. It is thought to represent repolarization of the Purkinje fibers or papillary muscles. Prominent U waves may indicate conditions such as hypokalemia, bradycardia, or certain drug effects.
The time between two consecutive R waves on an electrocardiogram (ECG), representing one complete cardiac cycle. It is commonly used to calculate heart rate and assess rhythm regularity; shorter intervals indicate faster heart rates, while longer intervals indicate slower rates.
A heart rhythm originating from the sinoatrial (SA) node, characterized by a regular rate of 60–100 beats per minute in adults, with consistent P waves preceding each QRS complex and a normal PR interval. NSR indicates normal electrical conduction through the heart.
A heart rhythm originating from the sinoatrial (SA) node with a rate of less than 60 beats per minute in adults. It is characterized by normal P waves preceding each QRS complex and a regular rhythm. Sinus bradycardia can be normal in well-conditioned athletes or occur due to medications, increased vagal tone, or certain medical conditions.
A heart rhythm originating from the sinoatrial (SA) node with a rate greater than 100 beats per minute in adults. It maintains normal P wave morphology and a regular rhythm, with each P wave preceding a QRS complex. Sinus tachycardia often occurs as a physiological response to exercise, stress, or fever, but can also indicate underlying conditions such as anemia, hyperthyroidism, or hypovolemia.
The physiological variation in the time interval between consecutive heartbeats, typically measured as fluctuations in the R-R intervals on an electrocardiogram (ECG). HRV reflects autonomic nervous system activity, with higher variability generally indicating better cardiovascular health and adaptability, while reduced HRV is associated with stress, fatigue, and certain disease states.
The volume of blood in a ventricle at the end of diastole, just before ventricular contraction. EDV reflects the heart’s preload and is a key determinant of stroke volume and cardiac output according to the Frank–Starling mechanism.
The volume of blood remaining in a ventricle at the end of systole, after ventricular contraction. ESV reflects the heart’s afterload and contractility and, together with end-diastolic volume, determines stroke volume and ejection fraction.
The amount of blood ejected by a ventricle during a single contraction, typically measured in milliliters. Stroke volume is calculated as the difference between end-diastolic volume (EDV) and end-systolic volume (ESV) and is a key determinant of cardiac output.
The percentage of blood ejected from a ventricle during systole relative to its end-diastolic volume (EDV). EF is calculated as (stroke volume/EDV) × 100% and is a key indicator of ventricular function; normal values for the left ventricle are typically 50–70%.
The volume of blood pumped by a ventricle per minute, typically expressed in liters per minute (L/min). It is calculated as the product of stroke volume (SV) and heart rate (HR): Q=SV×HR.
A physiological principle stating that the strength of ventricular contraction increases with greater end-diastolic volume (EDV), within physiological limits. This relationship ensures that the heart pumps out the volume of blood it receives, maintaining balance between venous return and cardiac output.
A fundamental principle in electricity stating that the current (I) through a conductor between two points is directly proportional to the voltage (V) across the two points and inversely proportional to the resistance (R).
The difference in oxygen content between arterial blood and mixed venous blood, reflecting the amount of oxygen extracted by tissues during circulation. It is a key indicator of tissue oxygen utilization and, along with cardiac output, determines oxygen consumption according to the Fick principle.
A principle used to calculate oxygen consumption (VO2) based on cardiac output (Q) and the arterial–venous oxygen difference (a-vO₂ difference).


.png)