3 Lab #3: Air Temperature
Lab #3: Air Temperature
Zachary J. Suriano
Introduction and Objectives
Air temperature is a key weather dimension, and one that influences our decisions on a day-to-day, or even hour-to-hour level. Knowledge of the air temperature informs our decisions about what clothes to wear, when it is safe to work or play outside, and when we should heat or cool our homes, among many other practical examples. In this lab, we will explore the various ways in which air temperature varies across space and time, including various applications of air temperature.
Specific learning objectives of this lab are to:
- Convert between different units of temperature.
- Analyze and interpret the diurnal cycle of temperature.
- Plot isotherms on a map of air temperature.
- Recall what Heating and Cooling Degree Days are and calculate their values.
- Determine the wind chill based on observations of air temperature and wind speed.
Temperature
We define temperature as the measure of the kinetic energy of an object, where kinetic energy refers to the average speed or motion of an object’s molecules. Putting these together, an object with a higher temperature has faster moving molecules, while an object with a lower temperature has slower moving molecules.
If an object’s molecules were perfectly motionless, there would be no kinetic energy and thus the temperature of the object would be at absolute zero. Absolute zero is the starting for a temperature scale called the Kelvin scale where there are no negative values. This makes the Kelvin scale very useful in scientific calculations, like the ones this lab will introduce. The Kelvin scale uses the units K. In daily life, the Kelvin scale is not commonly used outside of the scientific community. Instead, the Fahrenheit and Celsius scales are used dependent primarily on geographic location. In the United States, the Fahrenheit scale is used with units of °F, whereas the rest of the world primarily uses the Celsius scale with units °C. Table 3-1 shares some common temperatures across the three units.
Being able to convert between these scales is useful when evaluate weather conditions from different parts of the world. The equations to convert between scales are:
Fahrenheit to Celsius: °C = (°F – 32) / 1.8
Celsius to Fahrenheit: °F = (°C x 1.8) + 32
Kelvin to Celsius: °C = K – 273.15
Celsius to Kelvin: K = °C + 273.15
Fahrenheit to Kelvin: K = (°F + 459.67) / 1.8
Kelvin to Fahrenheit: °F = ( K x 1.8 ) – 459.67
| Kelvin (K) | Celsius (°C) | Fahrenheit (°F) | Process |
| 373 | 100 | 212 | Boiling point of water |
| 323 | 50 | 122 | |
| 313 | 40 | 104 | |
| 303 | 30 | 86 | |
| 393 | 20 | 68 | |
| 283 | 10 | 50 | |
| 273 | 0 | 32 | Freezing point of water |
| 263 | -10 | 14 | |
| 253 | -20 | -4 | |
| 243 | -30 | -22 | |
| 233 | -40 | -40 | Where °F and °C are the same |
Table 3-1. Common Temperatures of each scale rounded to nearest whole number.
Concept Check #1. Convert the following temperatures, rounding your answers to the nearest whole degree.
- 100°F = _____ °C
- 15°C = _____ °F
- 255 K = ____ °F
- -25°C = ____ K
The Diurnal Cycle
The daily cycle of surface air temperature is primarily dependent on energy inputs and outputs stemming from the Earth’s rotation and the radiation processes discussed in lab #2. While shortwave energy received is at a maximum at or near noon local time, this is typically not when the daily maximum temperature. Similarly, at midnight local time we are furthest from the receipt of shortwave energy, yet minimum temperature typically occurs just after sunrise. The timing of temperature maximum and minimum during the day are one of the key misconceptions in temperature variations.
Below, you will see a graphic depicting energy inputs and outputs for a standard location, along with the corresponding temperature for a 24-hour period (Figure 3-1). In the bottom panel, you will see an orange line that represents the amount of longwave radiation emitted by the surface (i.e., energy output) during the 24-hours, and a green line that represented the amount of shortwave radiation received (i.e., energy input). The times of relative surplus (more energy coming in than leaving) are in blue, while times of relative deficit (more energy leaving than coming in) are in red. In the top panel, you will see the resulting temperature at the corresponding times of surplus and deficit.
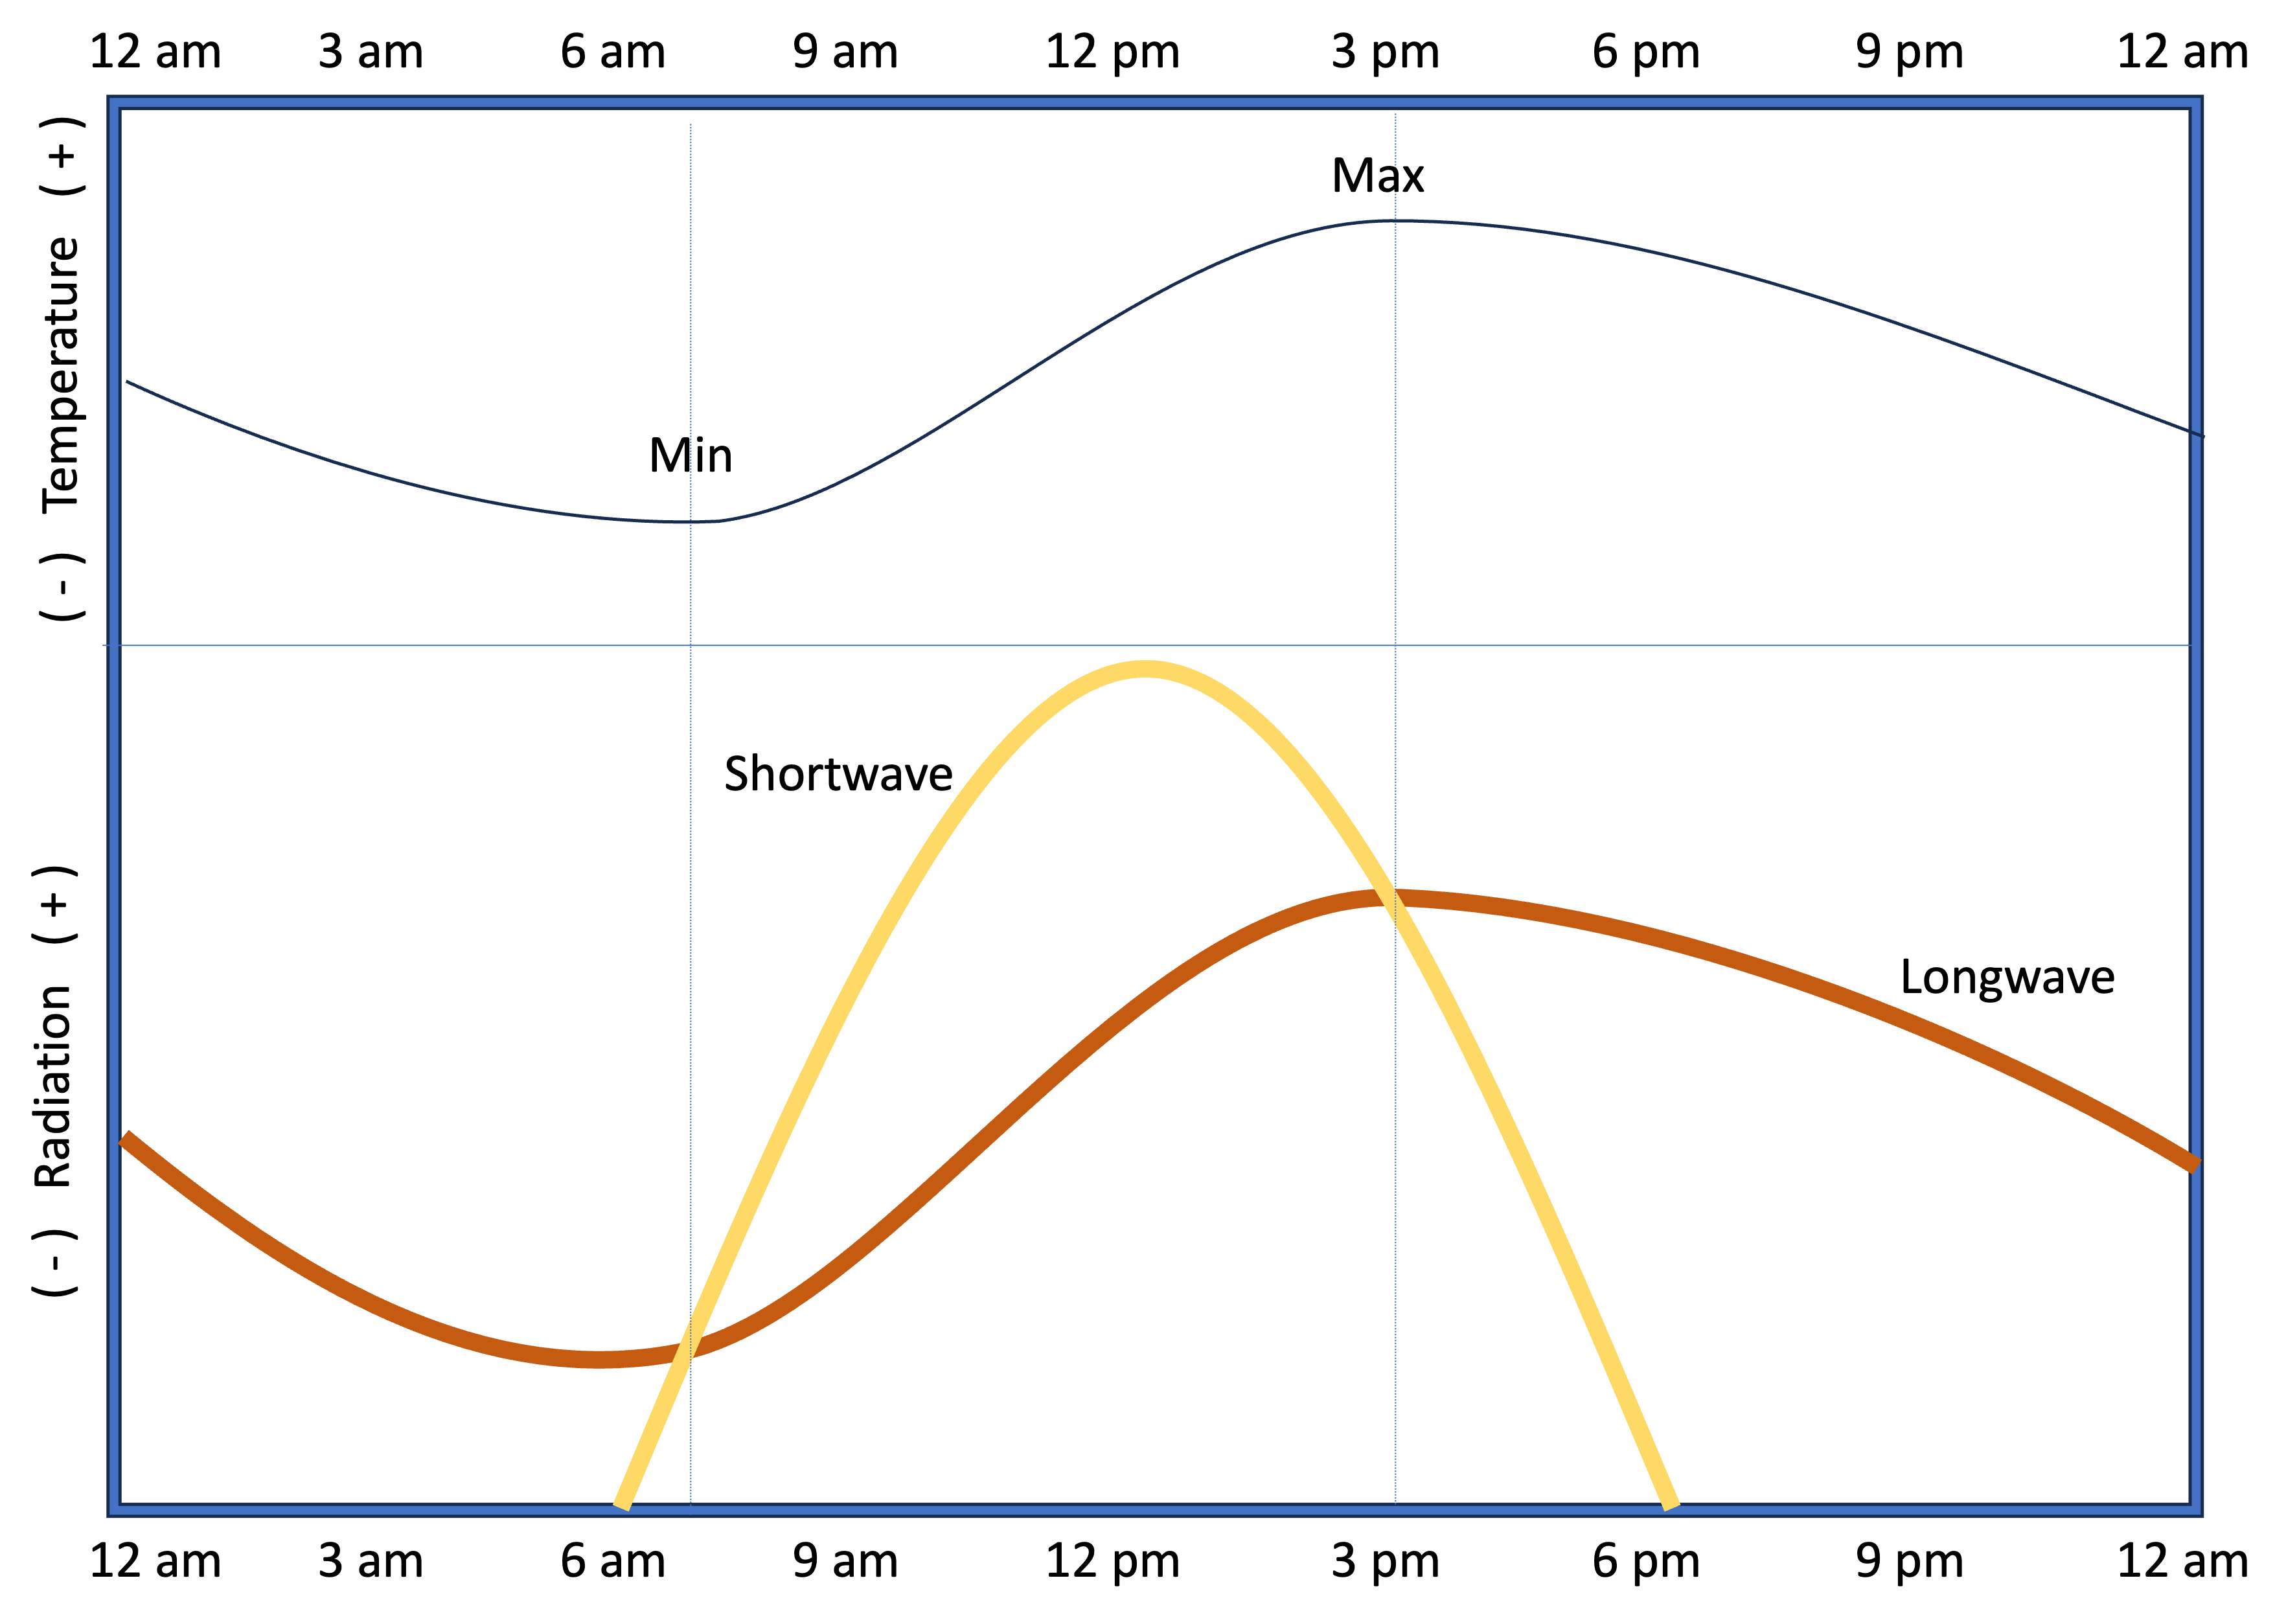
Note how the maximum daily temperature occurs in the middle of the afternoon, at the time where relative surplus of energy flips to relative deficit. This means from that intersection point forward, more energy is leaving than coming in, thus the temperature begins to decrease. In the morning, the minimum temperature occurs just after sunrise when the relative deficit of energy ends – not necessarily exactly when sunrise occurs.
Concept Check #2:
When during the day for a standard, cloud-free location, will the maximum daily temperature occur? Why?
Isotherms
Similar to how isobars on a map are lines of constant pressure, isotherms are lines of constant temperature. Visually, isotherms allow us to quickly identify regions with the same temperatures while also showcases regions with large temperature gradients (large changes in temperature over a certain distance). As we will learn later in the semester, fronts are dividing lines between air masses with different temperature and moisture conditions and are typically located in regions with large temperature gradients.
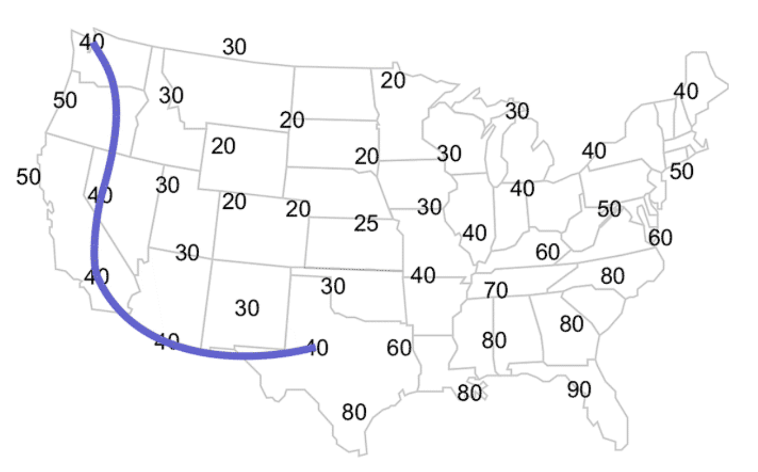
Below you will see an example of a temperature map with part of the 40° isotherm plotted (Figure 3-2). Note how the line connects the locations with temperatures of 40° where locations with lower temperatures are on one side and locations with higher temperatures are on the other. You’ll further note that the line is smoothed and not jagged. Finally, look at the line over the state of Oregon. To the west (along the OR coast) there is a location with 50°, and then to the east (in northern ID) there is a location of 30°. The 40° isotherm passes between the two locations. Because 40 is halfway between 30 and 50, the line passes roughly halfway between the locations.
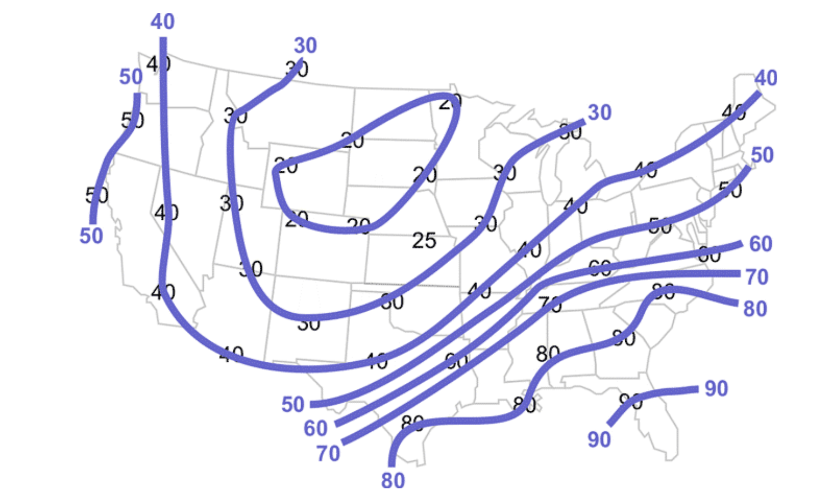
If you were to continue the 40° isotherm from central TX (Figure 3-3), you would need to keep the low temperature and high temperature locations on their respective sides of the contour (isotherm). It will pass between the 30° of western OK and the 60° of eastern TX into northern AR, and continue through IL and IN. If you then wanted to draw the 50° isotherm, you would need to first try and identify any locations with that temperature. If none are present, you will need to interpolate using the existing 40° isotherm and any locations of 60°. The 50° isotherm would fall between the 40 and 60° isotherms. Below you will see the map with 10° isotherms drawn in.
Concept Check #3:
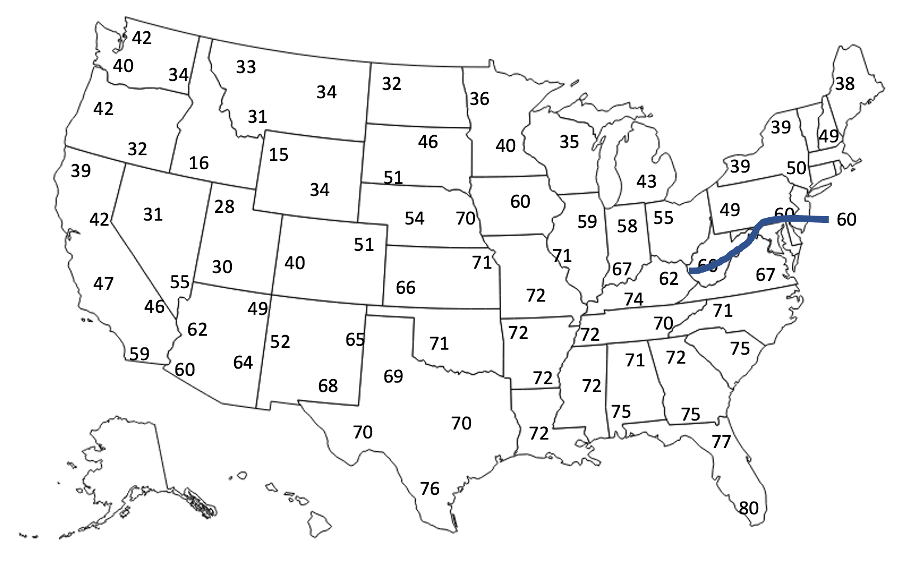
Given the following map of air temperatures, which direction should the 60°F isotherm next from its current location ending at the KY and WV border (Figure 3-4)?
Heating and Cooling Degree Days
One of the main ways temperature data are applied is for energy usage determination. A heating degree day is a statistic for estimating the amount of energy consumed for heating your home (or other building), where a cooling degree day for cooling the home. A day where the average temperature is colder than the baseline temperature of 65°F will require a home to be heated (typically), where if the temperature is above the baseline, the home will require cooling.
The magnitude of a heating or cooling degree day is calculated by the following equation: 65 – [ ( Tmax + Tmin ) / 2 ], where Tmax is the maximum daily temperature and Tmin is the minimum daily temperature. The calculation of ( Tmax + Tmin ) / 2 is to determine the daily average temperature.
If the answer to the equation is positive, this means the average daily temperature is less than the 65° baseline and heating is required. This value is the number of heating degree days. If the result is negative, that means the average daily temperature is more than the baseline and no heating is required. Take the absolute value of this answer (i.e., remove the negative sign) is the number of cooling degree days.
Example: For a day with Tmax = 87°F and Tmin = 55°F, how many heating degree days and cooling degree days are there?
= 65 – [ ( Tmax + Tmin ) / 2 ]
= 65 – [ ( 87 + 55 ) / 2 ]
= 65 – [ ( 142 ) /2 ]
= 65 – [ 71 ]
= – 6 <— this is a negative number, so there are 0 heating degree days, but 6 cooling degree days.
Concept Check #4
Using the values of Tmax and Tmin below (Table 3-3), calculate the number of heating degree days and cooling degree days. Be sure to first calculate the average daily temperature.
| Tmax (°F) | Tmin (°F) | Avg Temp. (°F) | Heating Degree Days | Cooling Degree Days |
| 45 | 31 | |||
| 71 | 55 | |||
| 79 | 53 |
Table 3-3. Used in completing concept check #4 by calculating average temperatures and then HDD and CDD.
Wind Chill
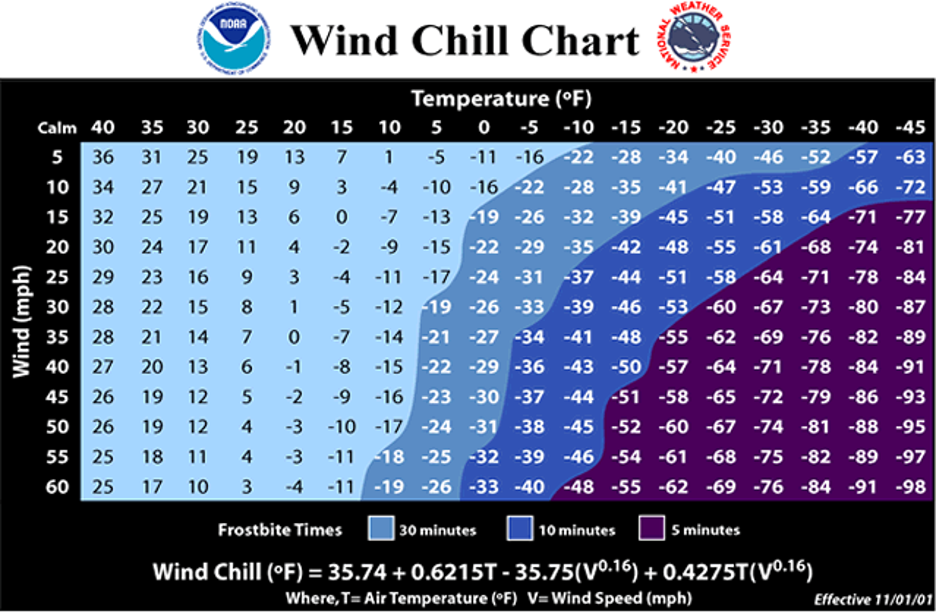
The wind chill index gives an indication of how cold exposed skin would feel by accounting for the air temperature and the wind speed, in relative terms of a “feels like” temperature. In calm conditions, the wind chill is equal to the air temperature, but the faster the wind, the colder the wind chill value becomes as the wind is able to take heat away from a person. The table below (Figure 3-5) plots wind chill values based on combinations of air temperature and wind speed. To read the chart, find the observed wind speed on the y-axis and then the air temperature on the x-axis. Where they meet in the table is the corresponding wind chill. The color shading indicates the approximate time it takes for frostbite to occur at the corresponding wind chill values from the National Weather Service. For example, air temperature of 30°F with 20 mph winds yields a wind chill of 17°F.
Concept Check #5.
What is the wind chill if the wind speed is 10 mph and the air temperature is 0°F?