9 Lab #9: Weather Forecasting
Lab #9
Zachary J. Suriano
Introduction and Objectives
Weather forecasts are something we have come to rely on from deciding what clothes to wear and whether to bring an umbrella to class, to informing critical business, safety, and agricultural decisions. Our personal experience indicates that forecasts of the future will occasionally be incorrect, but understanding what the forecasts mean and how to interpret them is an important skill this lab will address. Here, we will evaluate weather forecasts over different time periods (< 48 hr, 3-7 day, 8-14 day, and monthly/seasonal), learn about different types of informational statements provided by forecasters, and determine what statements like “30% chance for scattered showers” really mean.
Specific learning objectives of this lab are to:
- Analyze forecasts of various time scales to determine potential weather conditions.
- Differentiate various weather warnings, watches, and advisories.
- Describe what different precipitation probabilities mean.
Weather Forecasts
Short Range (0 – 72 hr) Prognosis
Similar to the analysis of surface observations we did in Lab 8 and in previous settings, forecasters analyze the weather prognosis (often shortened to “prog”) to inform their forecast over the coming hours and days. 12 and 24 hour progs are typically provided 4 times per day (12, 18, 00, 06Z), while 36 through 60 hour progs occur twice per day (12 and 00Z). Below you will see an example of a 24-hour prog of the US (Figure 9-1). Along the bottom, you will notice there is the day/time the forecast was issued (sometimes indicated by “IT”) as 1248Z on Thursday June 1, 2023. Recall that CDT is five hours behind UTC, and CST is six hours behind. So, 1248Z on June 1st is 7:48am CDT. Similarly, you will see the valid time (VT), which is the day/time the forecast is valid for. Here, it is 00Z June 2nd. The prog has the sea-level pressure field (isobars in black here) with Highs (blue H’s) and Lows (red L’s) marked, various fronts and boundaries (see Lab 8), and various precipitation zones.
Green shading corresponds to rain, blue to snow, purple to mixed precipitation, orange to ice, and red as thunderstorms. For rain and ice, this means measurable rain or ice, respectively of at least 0.01” at the valid time. For snow and mixed precipitation, this means measurable precipitation (in its respective phase) of at least 0.01” of liquid equivalent. In each case, lighter shades of each color indicate a chance for that precipitation, while darker shades indicates that precipitation is likely.
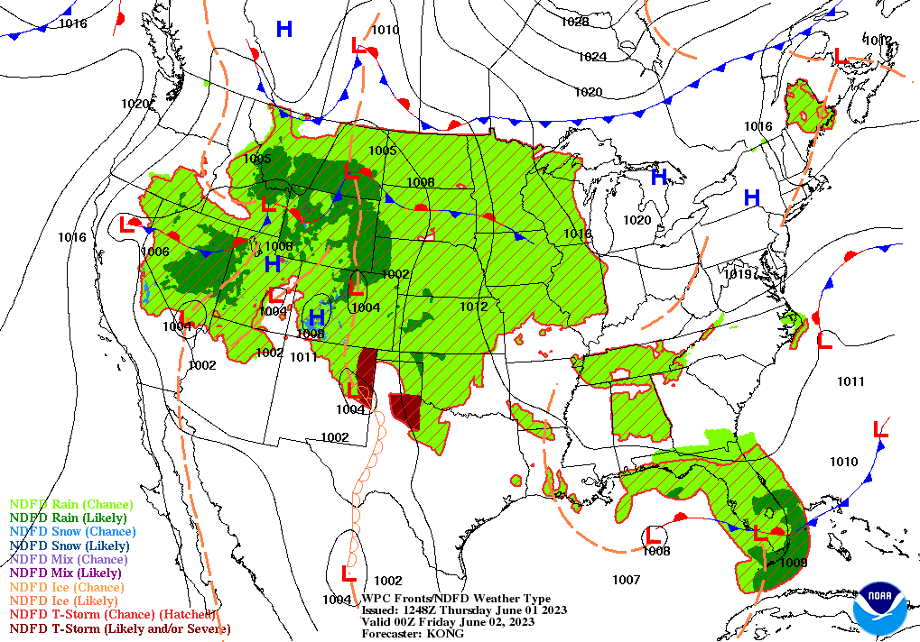
We can interpret the prog at the valid time just as we would a surface observation. In the example above, the forecast for 00Z June 2nd calls for a dryline to move into western TX associated with a 1004 mb Low pressure system in eastern New Mexico. There is chance for precipitation across much of the Great Plains and Upper Midwest, with thunderstorms likely in portions of northern Texas and eastern New Mexico. You can find short-term progs in a variety of locations. One is: https://aviationweather.gov/progchart/sfc
Concept Check
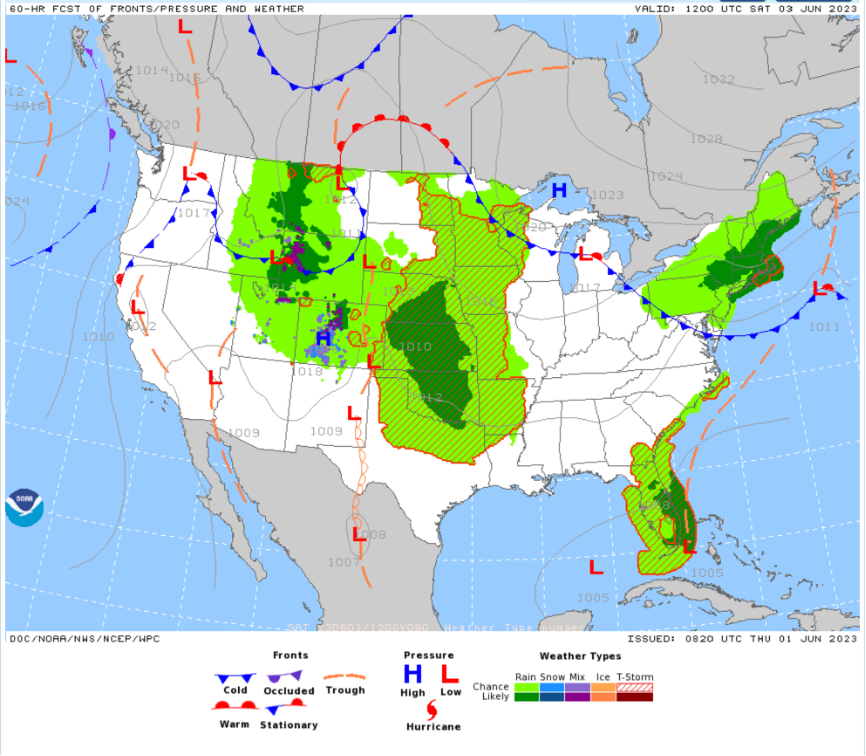
Below, a 60-hr prog is provided (Figure 9-2). Even though the graphic itself looks a little different than the example above, use the information contained to answer the following questions:
(a) What day/time is this prog valid for?
(b) Is any type of precipitation forecasted over KY? If so, what type?
(c) What type of front is forecasted over Oregon?
(d) What type(s) of precipitation are forecasted over Colorado, if any?
(e) What type of pressure system is forecasted over Montana?
(f) Where is there a dryline?
Medium Range Forecast (4-7 Days)
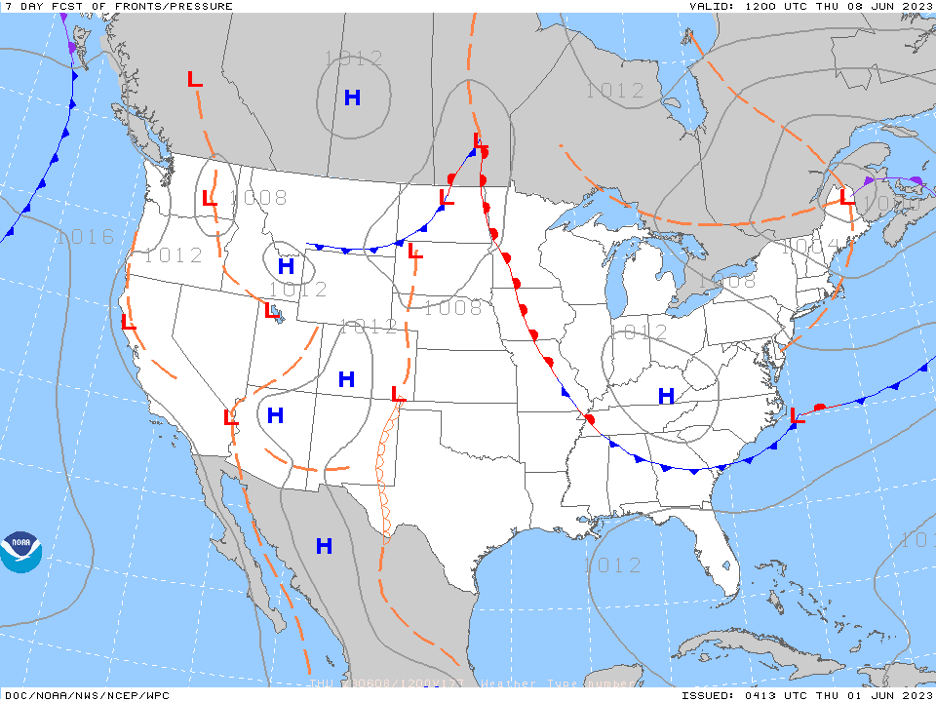
Once the length of forecast stretches beyond 3 days, typically the precipitation areas are removed from the prog. Given the timeline, progs beyond 3 days are only generated once per day at 12Z. Beyond a lack of precipitation zones, the prog of a medium range forecast can be interpreted much the same as a short-range forecast. Below is the 7-day prog for the US (Figure 9-3). Note the forecast for a cyclone over the northern plains, a warm front extending from ND southeast into MO, and a relatively weak 1012 hPa High pressure center over Kentucky. One location you can find medium range forecasts are from: https://www.wpc.ncep.noaa.gov/medr/medr.shtml
6-10 Day and 8-14 Day Outlooks
Beyond a week, the weather forecast changes from a prognosis to an outlook. This is due to the increase in relative uncertainty with the forecast the further you move into the future. Rather than a specific day, it is range of days that indicate the probability of above, normal, and below normal temperature and precipitation conditions. They are updated daily. Outlooks can be displayed a few different ways, most typically they look like Figure 9-4.
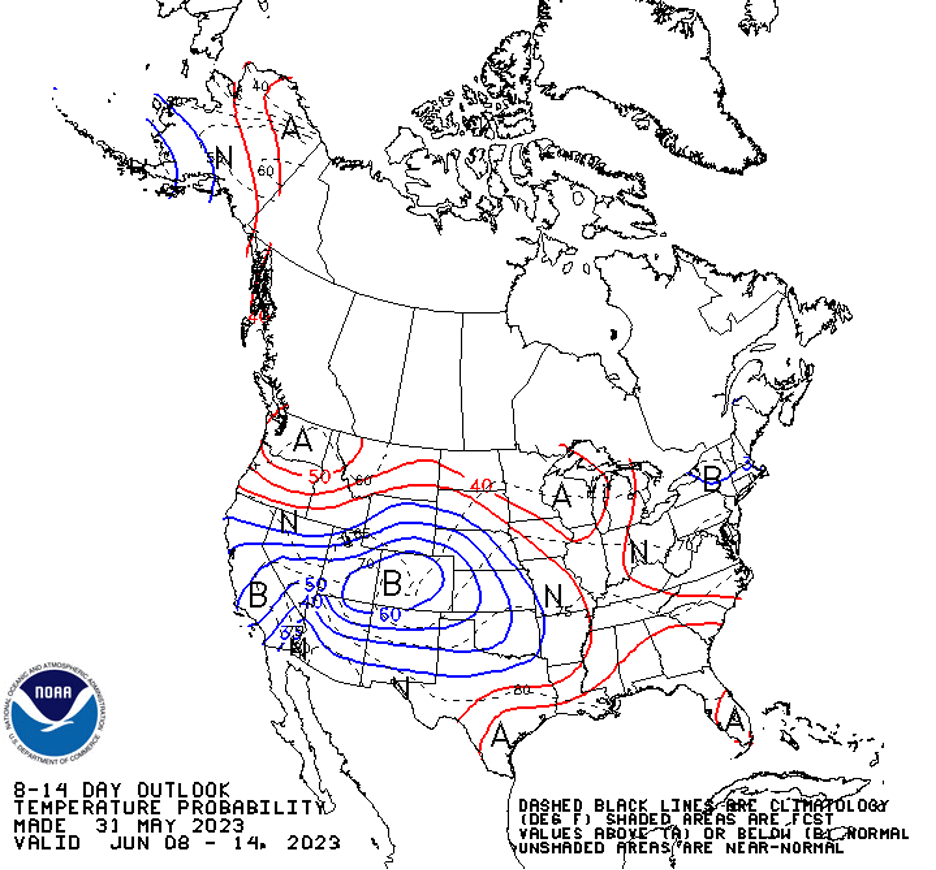
The labeled dashed black lines indicate what normal, in this case temperature, conditions look like for the valid time over the last 30-year normal (1991-2020). The red and blue solid lines and labels indicate the probably for above and below average conditions. In the example above, portions of CO and UT are marked as over 60% probability of below normal conditions. This means there is greater than 60% probability temperatures from June 8-14 will be below climatological averages, 33.3% probability temperatures will be near normal, and less than 7% probability for below normal temperatures. In much of the Mid-Atlantic region, temperatures are forecasted to be near normal for this period. While slightly harder to read, this format is helpful in that the normal conditions are also shown on the diagram so you have an indication of what “above” or “below” actually means. In contrast, a newer version of these graphics looks like Figure 9-5, in this case for the 6-10 Day Precipitation Outlook.
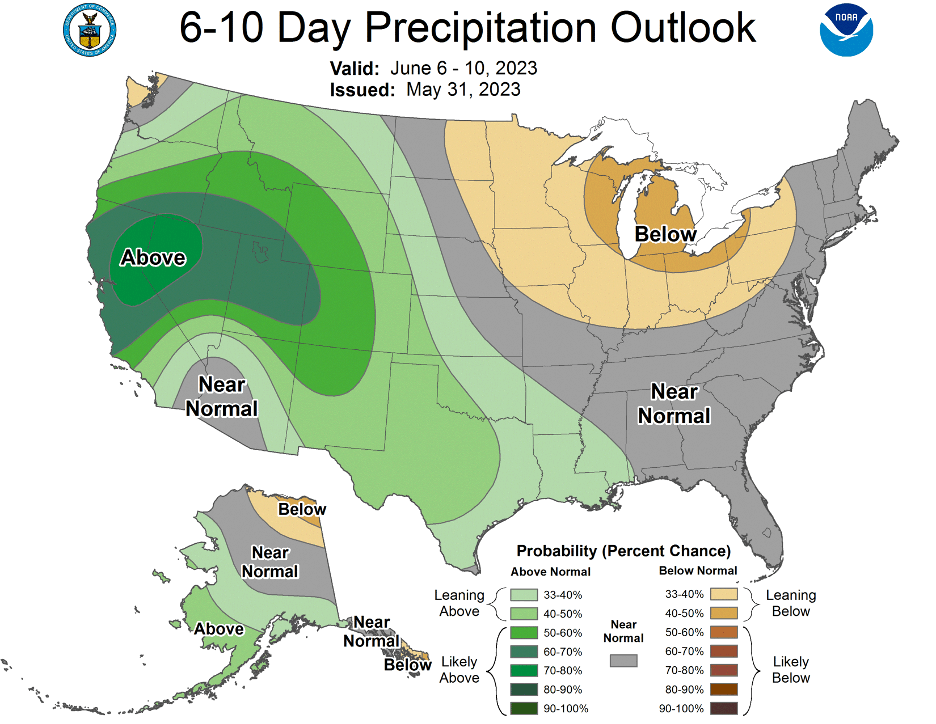
The same probability structure as 8-14 day outlooks is in place, but here they are color coded to more quickly identify areas of forecasted above/below/normal conditions. In this example, there is a greater than 70% probability for above normal precipitation in northern CA and western NV, while a 40-50% probability for below normal precipitation in the Great Lakes region. 6-10 and 8-14 day precipitation and temperature outlooks can be obtained from: https://www.cpc.ncep.noaa.gov/products/predictions/610day/ and https://www.cpc.ncep.noaa.gov/products/predictions/814day/, respectively. Selecting the “Lines-only format” link at the top of each page will generate the example shared on the previous page.
Monthly and Seasonal Outlooks
30 day (monthly) and 90 day (seasonal) climate outlooks are also generated, but at the frequency of once per month. The monthly outlooks are released in the afternoon on the last day of the previous month, while seasonal outlooks are updated around mid-month. These long-term outlooks display the probability in excess of 33% for temperature or precipitation variables to be above or below the long-term normal (Figure 9-6).
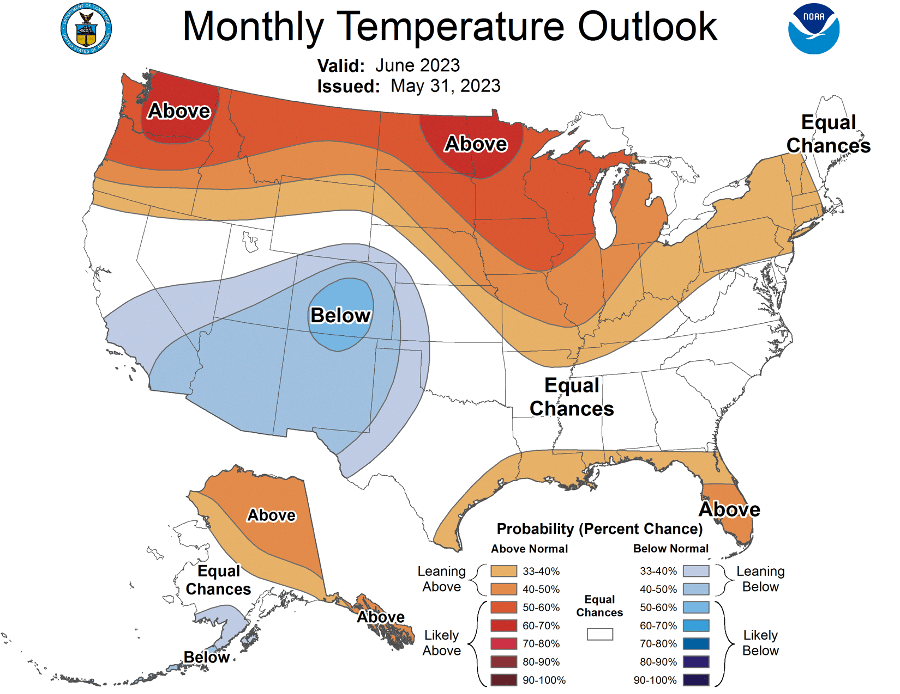
In the example above (Figure9-6), this indicates a 60-70% probability for above normal temperatures in June in northern ND and MN, just 33-40% probability for above normal temperatures in much of KY, and 50-60% probability for below normal temperatures in CO. Monthly Outlooks can be found: https://www.cpc.ncep.noaa.gov/products/predictions/30day/, while seasonal outlooks are found: https://www.cpc.ncep.noaa.gov/products/predictions/90day/
Concept Check
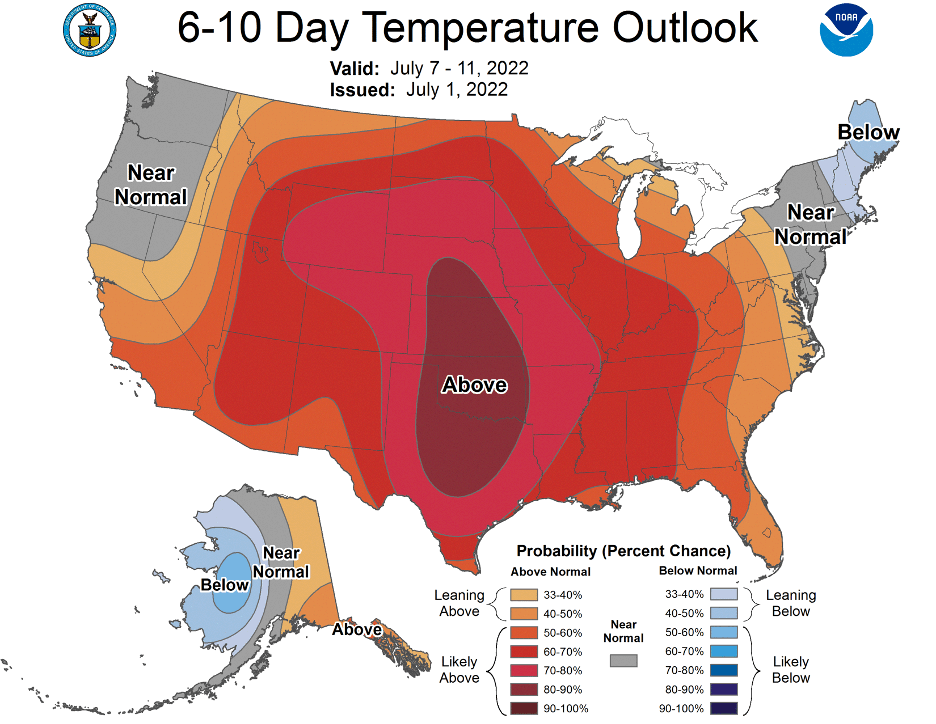
Using the following map (Figure 9-7), answer the following questions:
(a) What days is this outlook valid for?
(b) What states (list them) have a probability of at least 33% for below normal temperatures during the valid period?
(c) What is the probability for WKU to have above average temperatures during the valid period?
(d) What is the probability for central OK to have above average temperatures during the valid period?
Weather Warnings, Advisories, and Watches

These notifications are issued for a variety of hazardous weather events, such as blizzards, frost, wind chills, fire weather, hurricanes, gales, high wind, fog, tornados, flooding, and excessive heat, among others. For some events, such as severe thunderstorms and tornadoes, the Warnings, Advisories, and Watches mean the same thing everywhere in the country. However for other events, the intensity/magnitude thresholds for notification change spatially across the US. For instance, a Winter Storm Warning could be issued in eastern Montana for at least 6” of snow in 12 hours or at least 8” in 24 hours, compared to just 2” of snow in central Alabama. Examples of these thresholds are available at the NWS offices’ websites. WKU is in the Louisville Office and their thresholds can be found at the following link by selecting the “?” next to each notification type: https://www.weather.gov/lmk/DSS_Severe
Concept Check:
Glasglow, KY is forecasted to receive a steady accumulation of 2-3 inches of snowfall in the next 24 hours. What type of notification should the NWS Louisville Office issue?
(a) Winter storm warning
(b) Winter storm watch
(c) Winter weather advisory
(d) None of the above
Precipitation Probabilities
Precipitation Probability (PoP) is the likelihood of a measurable amount of liquid precipitation (either liquid or water equivalent for frozen precipitation types) for a specific time period at any location within the specific forecast area. Recall, measurable is defined as at least 0.01 inches. Typically, the forecast zone corresponds to a county. The likelihood is given as a percentage (Table 9-1).
| PoP Percent | Expression | Equivalent Areal Qualifiers (for convective env. only) |
| 10% | None used | Isolated, or few |
| 20% | Slight chance | Widely scattered |
| 30-50% | Chance | Scattered |
| 60-70% | Likely | Numerous (or none used) |
| 80-100% | None used | None used |
Table 9-1. PoP table for percentage, expression, and convective areal qualifiers.
Concept Check
If the local NWS office indicates there is a 50% precipitation probability this afternoon for the forecast area, what does that mean?