8 Lab #8: Air Masses, Fronts, and Mid-Latitude Cyclones
Lab #8
Zachary J. Suriano
Introduction and Objectives
Building on the content from previous labs, here we will be putting our understanding of temperature, humidity, and winds together in evaluating air characteristics over large regions and how they interact with each other to help initiate a highly influential weather pattern: the mid-latitude cyclone. Prior to beginning this lab, if you do not feel confident about your understanding of what a station model is and how to analyze it, you are encouraged to revisit Lab 6 and Lab 7 where the station model and its characteristics are noted. You may also consult your class notes and/or other resources.
Specific learning objectives of this lab are to:
- Identify different air mass characteristics and their source regions.
- Apply understanding of station models to differentiate frontal boundaries.
- Explain the stages of mid-latitude wave cyclone development.
- Describe the different types of mid-latitude cyclones.
Air masses and Source Regions
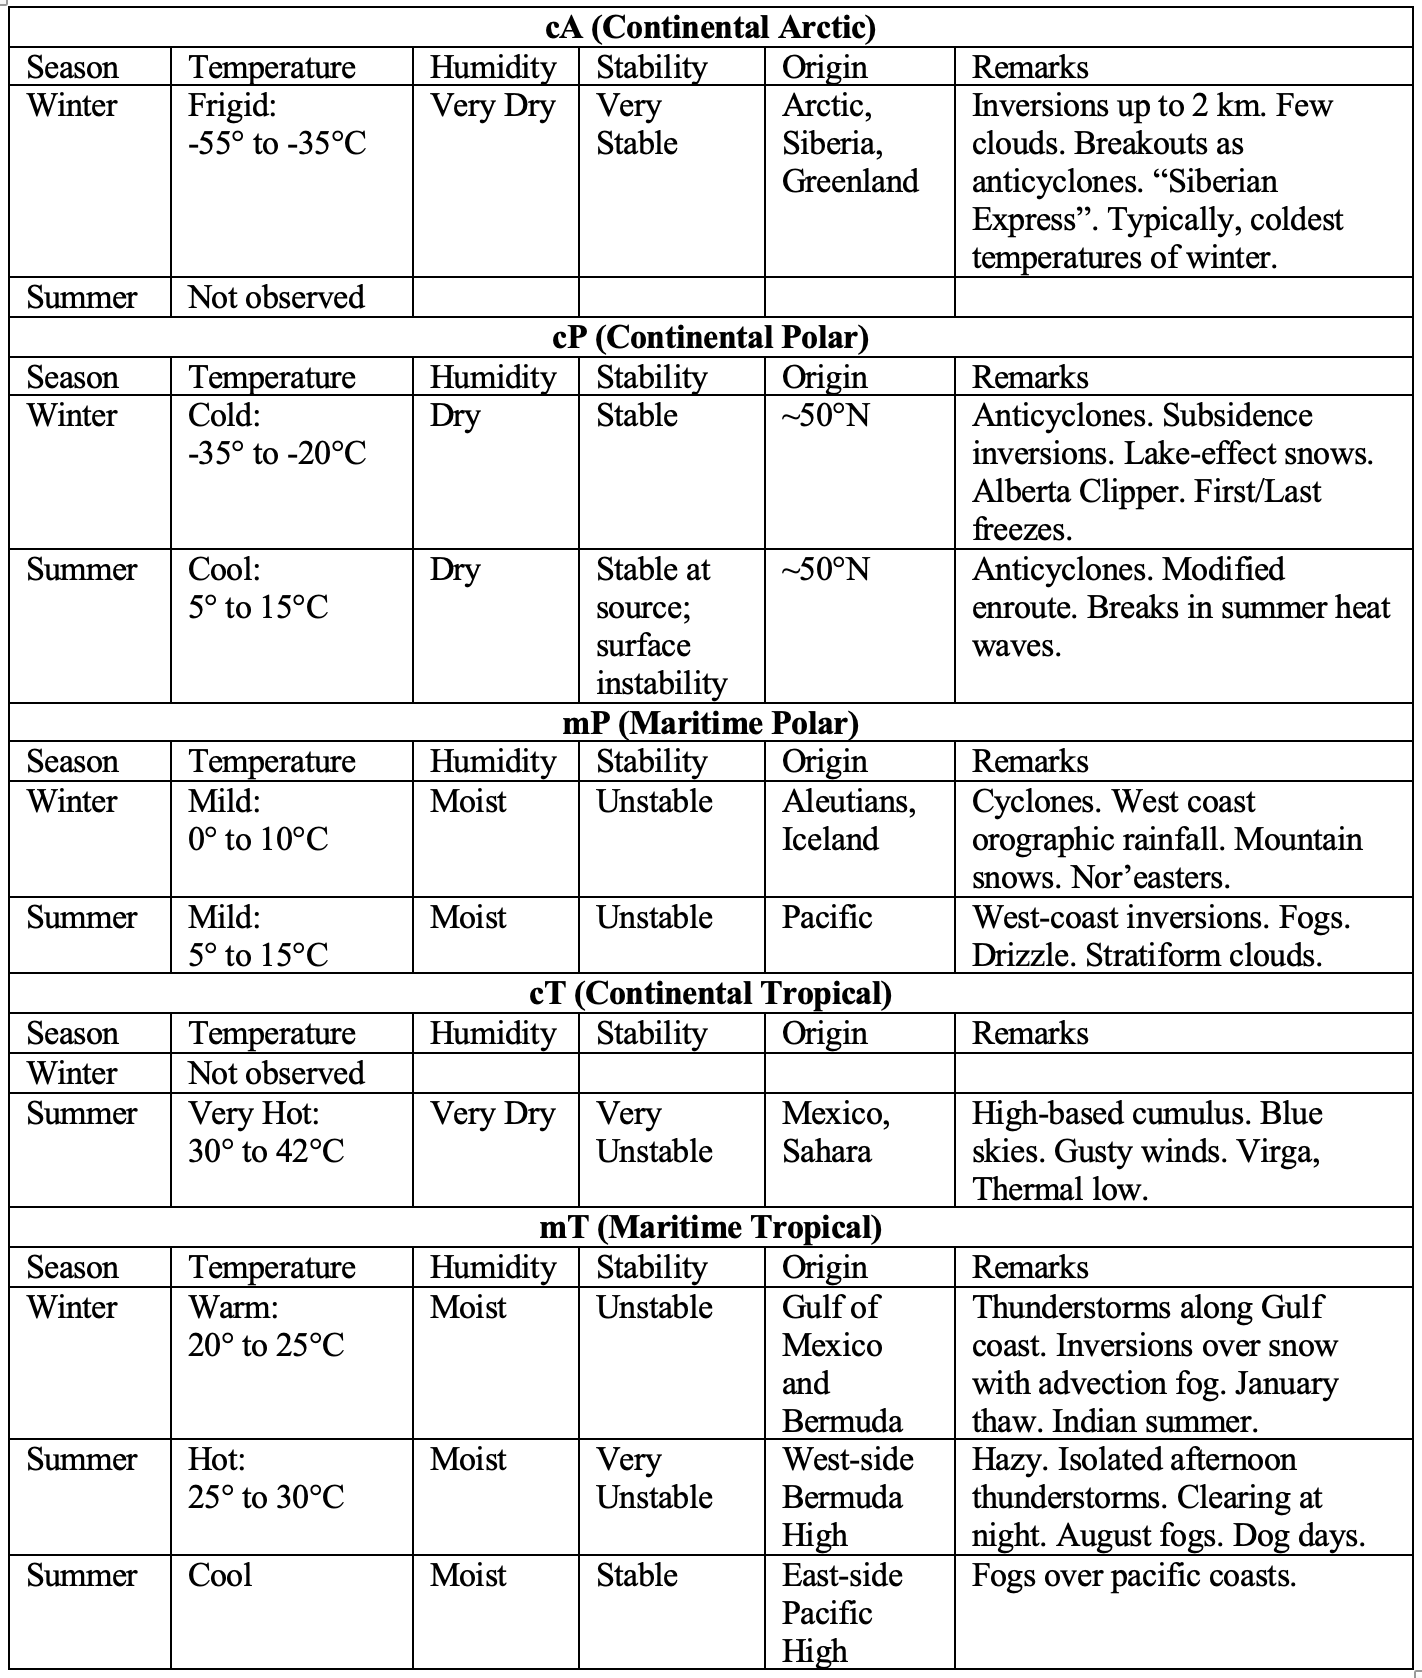
An air mass is a large volume of air that has relatively homogeneous temperature and moisture characteristics. These characteristics are acquired from the surface region the air mass came from, or its source region, and we use a two-letter acronym to identify them. First is the region that the air mass acquired its moisture characteristics: “c” for continental or “m” for maritime. Note how the “c” and “m” are lowercase. A continental air mass formed over land and as such, is relatively dry due to the limited moisture source. A maritime air mass formed over a large body of water (e.g., ocean) and as such, is relatively moist due to moisture availability. Second is the region that the air mass acquired its temperature characteristics, represented by an uppercase letter. “A” for Arctic, “P” for Polar, “T” for Tropical, and “E” for Equatorial, where they are ordered from coldest (Arctic) to warmest (Equatorial). To determine the air mass, you merge the two letter together, with the moisture conditions first (e.g., mT is a maritime Tropical air mass). There are eight different combinations: cA, cP, cT, cE, mA, mP, mT, mE
Concept Check
Name the following airmasses by their shorthand label:
(a) cA
(b) mP
(c) mE
The table below gives some basic descriptors to each of that regularly impact the United States (Table 8-1). While ai masses take on characteristics of their source region, it is important to note that they can be modified by the surrounding environment as that move.
Fronts
The air masses previously discussed do not exist in a vacuum. They regularly move around based on the prevailing winds and can interact with each other. The transition zone between two different air masses are called fronts. Fronts divide air masses of different densities, where density is dependent on temperature and moisture characteristics. We will discuss 5 different fronts here, and identify a few other types of boundaries that are often labeled on a surface weather map.
Warm Front
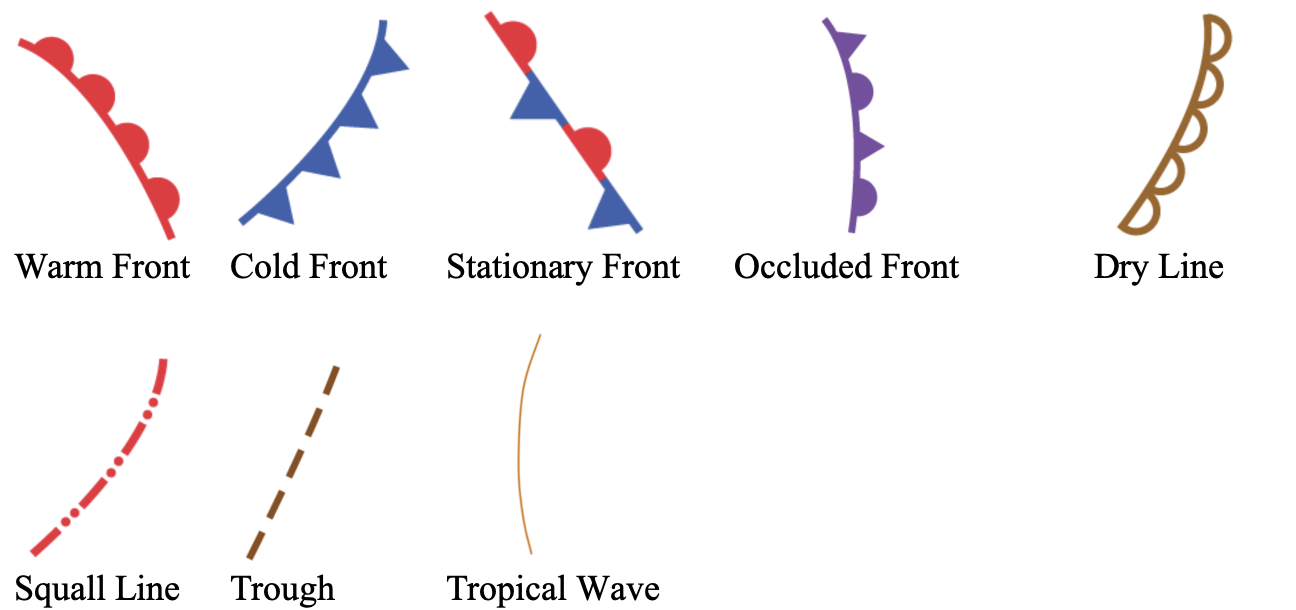
The transition zone between a warm air mass (e.g., mT) that is moving in and the cooler air mass it is replacing (e.g., cP) is a warm front (Figure 8-1). Because the warmer air is less dense than the cooler air, the frontal boundary between the warm and cool air is very shallow and gentle as the warm air rides up and over the retreating cool air. This results in typically light and prolonged precipitation associated with stratus and nimbostratus clouds ahead of the front. Further ahead of the warm front, cirrus clouds are often seen as the warm air continues to ride up over the cold air. Even without a weather map, you can tell a warm front is approaching in the next day or two from the detection of these cirrus clouds. We represent warm fronts on a map as a red line with red semi-circles. The semi-circles point in the direction the warm air is moving.

Cold Front
The transition zone between a cold air mass (e.g., cP) that is moving in to replace a relatively warmer air mass (e.g., mT) is called a cold front (Figure 8-2). With the cold air moving in being denser, it acts like a wedge sliding under the warmer air and lifting it, with a sharp and deep frontal boundary. The warm air is lifted rapidly and can lead to cumulonimbus clouds, along with intense but brief precipitation. Depending on stability, additional vertically-developed clouds and/or precipitation can form ahead of the front in the form of squall lines. We represent cold fronts on a surface map by a blue line with blue triangles that point in the direction the cold air is moving.

Stationary Front
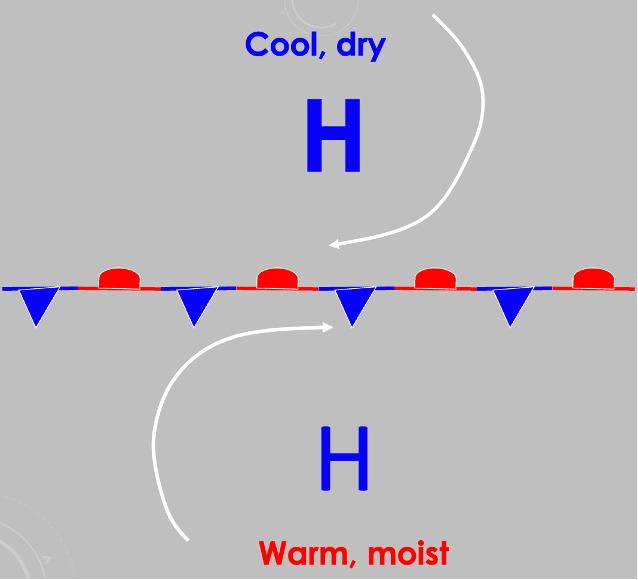
A stationary front divides two airmasses of different densities in situations where neither airmass is substantially moving towards/away from the other (hence the name stationary) (Figure 8-3). One way we can see a stationary front develop is when we have two high pressure systems that result in parallel but opposite flow, as shown below. In this example, wind is blowing clockwise around both Highs, thus in the center we have winds moving roughly parallel to each other. Stationary fronts are represented by alternating blue triangles and red semi-circles, in opposite directions.
Occluded Front
An occluded front occurs when a cold front overtakes a warm front (Figure 8-4). This is possible as a cold front moves faster, horizontally, and can “catch up” to a warm front as they move associated with a mid-latitude cyclone. There are two different types of occluded fronts depending on how cold the airmass behind the cold front is relative to the air ahead of the warm front. In a cold occlusion, the cold airmass behind a cold front overtakes and lifts the warm airmass of the warm front aloft, and thus directly interacts with the cool ahead that was ahead of the warm front. In a warm occlusion, the same process occurs but the air that is ahead of the warm front is actually colder than the air behind the cold front. In both cases, the warm air is lofted upwards and clouds and precipitation are possible. Occluded fronts are represented by purple lines with alternating purple semi-circles and purple triangles (the combination of cold and warm fronts: red + blue = purple).

Dry Line
The last type of front we will examine in detail is called a dry line. This is the transition zone between an advancing dry air mass from the existing moist air mass. The dry air mass is more dense, and similar to a cold front, acts as a wedge to lift moist air aloft where clouds, precipitation, and severe weather are possible. Dry Lines are represented by an orange or brown line with connected open semi-circles.
Identification of Fronts from Surface Maps and Station Models
Most easily, fronts can be identified by their color- and shape-coded labeling on a surface map. While referenced above, you will also see the visual representations of various fronts and other common boundaries (Figure 8-5).
If the front wasn’t label though, you could still identify it based on the following criteria:
(1) a sharp temperature gradient (i.e., rapid change in temperature over a short distance)
(2) a sharp dew point gradient (i.e., rapid change in dew point over a short distance)
(3) shifts in wind directions
(4) clouds and precipitation patterns
(5) pressure changes.
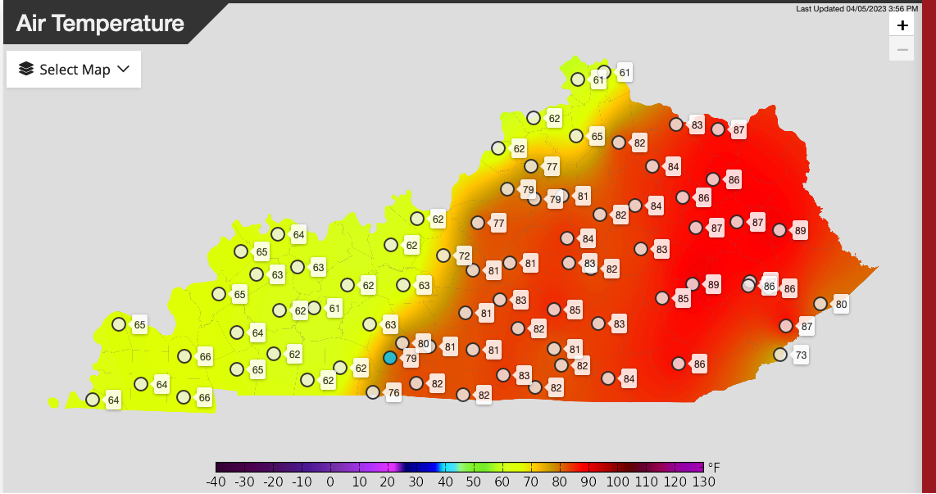
The example below is from April 2023 when a cold front moves through Kentucky (Figure 8-6). Even though the front is not labeled, it is clearly visible by the approximately 20°F change over just a few counties.
Concept Check
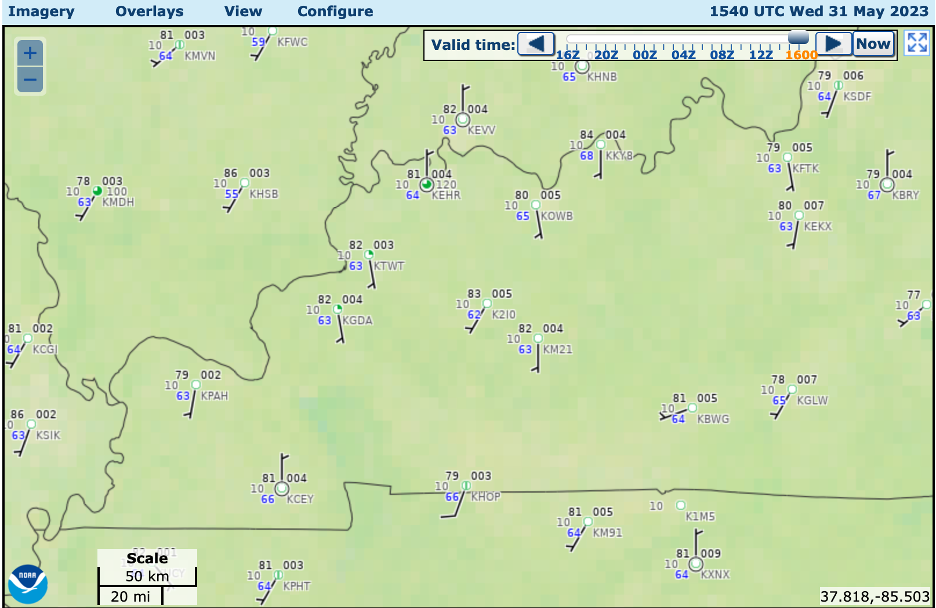
To identify fronts from station models on a surface map, you need to feel comfortable reading station models. Revisit your Lab 6 and Lab 7 notes, plus any additional class or outside resources as needed (https://www.wpc.ncep.noaa.gov/html/stationplot.shtml). As practice, answer the following questions from the station model map of western KY (be sure to include units!) (Figure 8-7):
(a) What is the air temperature in Bowling Green (KBWG)?
(b) What is the wind speed in Bowling Green (KBWG)?
(c) What is the cloud over in Louisville (KSDF)?
(d) What is the wind direction in Evansville (KEVV)? Report your directional answer to the nearest secondary intercardinal direction (i.e., 16 point compass: N, NNE, NE, ENE, etc.))
(e) What is the dew point temperature in Evansville (KEVV)?
(f) What is the pressure value in Bowling Green (KBWG)? Hint, be sure to translate the raw station model value to the real pressure value.
Mid-Latitude Cyclones
Cyclogenesis
Recall, a synoptic-scale low pressure system in the middle latitudes is called a mid-latitude cyclone. The fronts discussed previously usually occur in conjunction with these cyclones as air is mixed. From an energy perspective, a mid-latitude cyclone is one way the atmosphere tries to achieve balance from the areas of relative surplus and deficit of radiation. The development, or intensification, of a mid-latitude cyclone is called cyclogenesis.
Two pieces are needed for a mid-latitude cyclone to form, (1) a surface front between airmasses of different characteristics, and (2) an area of upper-level divergence. Unpacking these pieces further
- (1) The greater the density gradient along the front, the stronger the system may become. A low pressure center may form along a cold front or a station front where we can get spin to develop at the surface. Consider the example of the stationary front from earlier in lab, where we had two high pressure centers leading to parallel but opposite flow. If you were to put a pinwheel along the front, the flow from the two high pressure centers would start spinning the air at the front counterclockwise. This counterclockwise spin, or vorticity, can cause upward motion and the beginnings of low pressure. If that is all that occurs, the system will weaken and diminish.
- (2) However, if the second piece of cyclogenesis is present, the system will strengthen. An area of upper-level divergence refers to winds that diverge, or move apart from each other, at higher levels of the atmosphere. If air aloft is diverging, that means there is some amount of air that is being removed from the column at that point, just as if air aloft is converging, that means there is some amount of air that is being added into the column at that location. Thinking back to what high pressure and low pressure mean, if you are adding more air to the column above you, you are adding more mass. More mass of air means higher force applied by that air and thus higher pressure. If you are removing air from the column above you, you are removing mass, thus less force is applied and you have lower pressure. To try and rebalance the mass from divergence and convergence aloft, the atmosphere will either draw air upwards to replace what was diverged away, or sink air downwards to remove excess.
Bringing this back to our second required piece for cyclogenesis, if you have diverging air at high levels of the atmosphere (“aloft”), you are removing mass from the atmosphere at the column’s location. Less mass is less force applied and you have lower pressure. If you have diverging air aloft, the atmosphere responds by drawing air upwards from the surface, causing rising motion. When we couple the rising motion and low pressure tendency caused by upper level divergence with the rising motion and low pressure tendency caused by our frontal boundaries, you can form or rapidly intensify a mid-latitude cyclone.
Wave Cyclone Development Stages
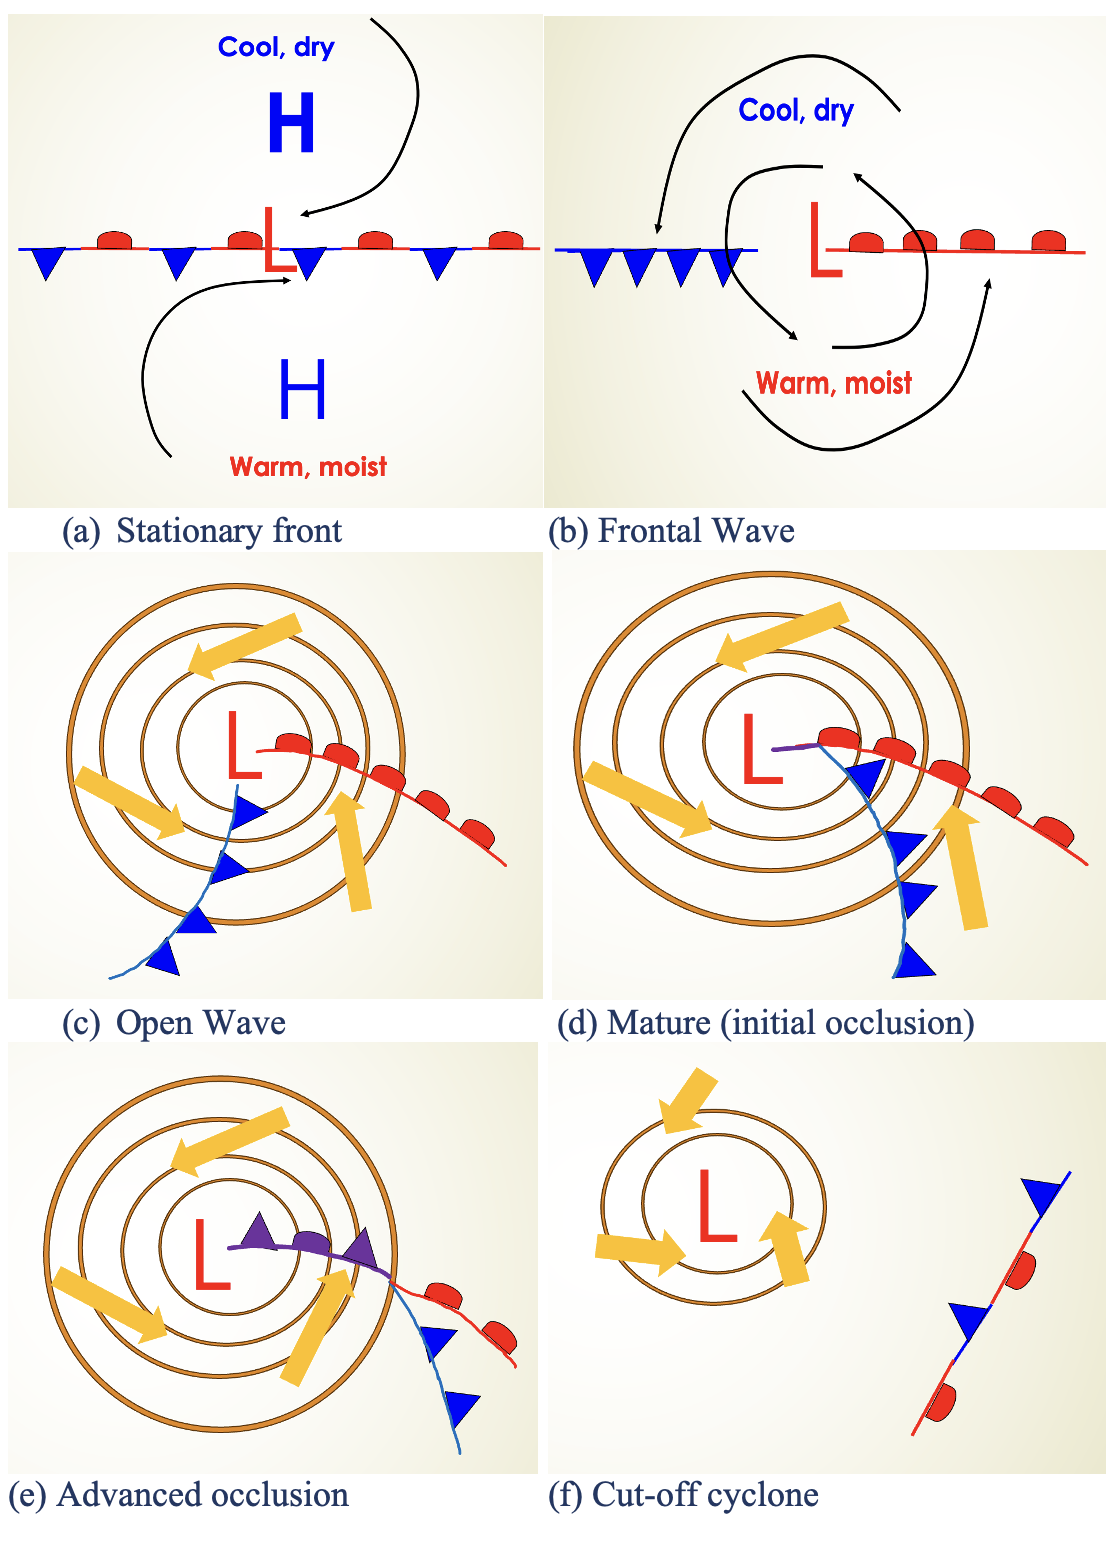
Once formed, a mid-latitude cyclone will go through a distinct life cycle that can last for a few days up to a week or longer in extreme cases. The first stage is cyclogenesis (Figure 8-8) where a surface low develops along the polar front. The second stage is that of a frontal wave, where the counterclockwise surface winds and convergence associated with the low pressure center and cause the airmasses that were on each side of the forming stationary front to begin to move towards the other. This creates a warm front on one side of the low and a cold front on the other side. Next is the open wave stage. Here there are distinct low pressure center with several isobars surrounding the center that result in stronger convergence and cyclonic flow inwards. Cold and warm fronts are pronounced and precipitation is apparent along both fronts. Sectors of the cyclone are named, with the warm sector being the warm airmass ahead of the cold front but behind the warm front; the cold sector being behind the cold front; and the cool sector ahead of the cold front. As the open wave cyclone matures, the cold front will begin to catch up to the warm front. Once it initially does, typically closest to the center of the low, the cyclone is said to be in its next phase: the mature phase (or initial occlusion phase). As the cold front continues to advance on the warm front, more and more of the system becomes occluded (advanced occlusion phase). Clouds and precipitation are common not just along the warm and cold fronts, but also now in the northwester quadrant of the storm (in the Northern Hemisphere) were what is called wrap-around precipitation occurs. Once there is extensive occlusion, the system will continue to weaken and often times upper level winds will shear (or divide) the central low from the cold and warm fronts. The low, now a cut-off or cold-core low, can stall and spin for sometimes a week or more before dissipating completely.
Lee Cyclones
When a mid-latitude cyclone forms downwind, or leeward, of a mountain range, it is called a Lee Cyclone. These form slightly differently from a wave cyclone in that its formation mechanism is the result in wind flow over the mountain that results in vertically expanded air on the leeward side of the mountain that results in trough development and, if conditions are right, a mid-latitude cyclone. In North America, examples would be an Alberta Clipper and a Colorado Low.
Thermal Lows
A low that forms from the heating of the surface is called a thermal low. These typically are not associated with fronts and tend not to move large distances as they are shallow and weaken quickly when away from their source region. They are often seen in northern Mexico and in the Great Basin of the US.
Regenerative Lows
As noted above, mid-latitude cyclones often have a life cycle of about 3-5 days. However, if the low were to encounter an environment with the right conditions, it could regenerate and restrengthen. This is most often observed as a mid-latitude cyclone tracks east off the Atlantic coast of the US where the relatively warm and moist air offshore, compared to the cooler and drier continental conditions, provides a zone of baroclinicty that reinvigorates the Low. A Hatteras Low is one example of this. Many Nor’easters regenerate in this region of coastal North America.
Concept Check
The type of cyclone that is least likely to move is:
(a) Wave cyclone
(b) Lee cyclone
(c) Regenerative low
(d) Thermal low