7 Lab #7: Atmospheric Circulations
Lab #7
Zachary J. Suriano
Introduction and Objectives
There are multiple different spatial and temporal scales at which the wind moves within the atmosphere, ranging from microscale processes such as how wind can channel between buildings on campus, to global-scale processes that govern the jet streams. Each process contributes to the climatology of the region and influences our lived experience at such locations. This this lab will examine these different atmospheric scales from the perspective of the types of circulations that occur in various environments across the planet.
Specific learning objectives of this lab are to:
- Apply understanding to general circulation to determine typical large-scale winds.
- Identify areas of surface high and low pressure.
- Describe how the following local circulations form: sea-breeze, land-breeze, valley breeze, mountain breeze.
- Differentiate the conditions between El Nino and La Nina.
General Circulation
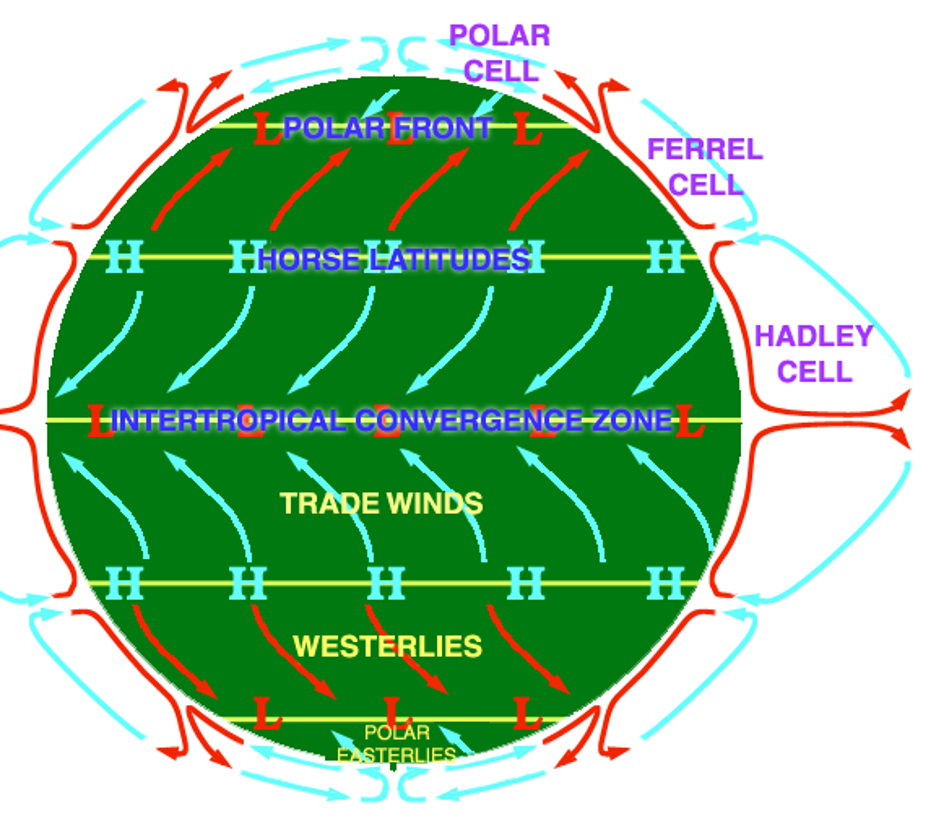
As we learned in previous units of the course and lab, there is a surplus of energy in the tropical regions and a relative deficit in the polar regions due to where more shortwave radiation is received from the Sun. This imbalance results in the atmosphere transporting energy, in the form of warm air, from the tropical regions towards the poles and relatively cool air back towards the equator. However, due to the forces discussed in Lab 6, it a relatively complex process. The model below (Figure 7-1) depicts the general horizontal surface wind directions, vertical circulations, and surface pressure centers we see, on average, across the planet. The follow sub-sections will detail a number of the key features on this idealized model: Pressure Centers, Hadley Cells, and Surface Winds.
Pressure Centers
Under this general circulation model, we typically see High- and Low-pressure centers in specific locations. Examine the graphic above. Note how Low pressure is observed at the equator (0° latitude), and at 60°N and S latitude (red “L”s) while High pressure is observed at the Poles (90°N and S latitude), and at 30°N and S latitude (blue “H”s). These configurations are important in determining the surface wind field that we will explore in the following section. For now, each of these distinct Low and High pressure locations are given a special name.
The Low pressure found at the equator is called the Intertropical Convergence Zone (ITCZ). The ITCZ is a zone where the trade winds from each hemisphere converge and results in upward motion in the atmosphere. This upward motions leads to a band of clouds that typically circumnavigate the planet and results in some of the largest annual precipitation totals on Earth. Not by coincidence, the areas influenced by the ITCZ align well with where tropical rainforests are observed. While static in the idealize model, it should be noted that the ITCZ does travel north and south during the calendar year, shifting with solar declination (the latitude where the Sun’s rays are directly overhead). The other zone of Low pressure is called the Polar Front. This marks a typically sharp gradient in temperature between the polar and ferrel cells of circulation. Similar to the ITCZ, the Polar Front shifts latitudinally with the seasons. In summer, the Polar Front is shifted closer to the poles while in winter it is shifted towards the equator impacting the mid-latitudes.
The High pressure at the 30°N and S latitudes goes by multiple names. The pressure center itself is typically called the Sub-Tropical High and results in calm winds and sinking air at these locations. You’ll recall that when air sinks adiabatically, it contracts and warms. This limits the potential for cloud development and precipitation. As such, locations impacted by the Sub-Tropical High are typically warm and dry, and not by coincidence, correspond to where we observed many of Earth’s major deserts. The latitudes (or locations) at which the Sub-Tropical High occurs are called the Horse Latitudes. For details about the history of this name, consult the National Ocean Service website: https://oceanservice.noaa.gov/facts/horse-latitudes.html. The High Pressure centers at the poles are called the Polar Highs.
Surface Winds
With an appreciation of where our High and Low pressure centers are located, we can use this information to understand how wind directions are determined on the idealized model (shown in blue and red lines on the surface). Recall from Lab 6 that the pressure gradient force acts to move the air from High to Low pressure. Thus winds begin to move from High to Low. Once in motion, the Coriolis force begins to deflect the wind to either the right of the direction of motion in the Northern Hemisphere or the left of the direction of motion in the Southern Hemisphere.
In the Northern Hemisphere, there are three main wind zones: 0°-30°, 30°-60°, and 60°-90°. In the first zone, we have Low pressure at 0° and High Pressure at 30°N. Here, winds take a general north to south path, and then are deflected to the right (of direction of motion). Thus, winds move from the NE to the SW. These winds are called the Northeast Trade Winds.
In the zone from 30°N to 60°N, we have High pressure to the south and Low pressure to the North. Winds will start to move from south to north, and then be deflected to the right of the direction of motion, yielding winds that flow from SW to NE. These winds are called Westerlies.
In the zone from 60° to 90°N, we have Low pressure to the south and High pressure to the north. Winds will start moving from north to south, and then deflect according to the Coriolis Force. This yields winds that flow from NE to SW, and are called the Polar Easterlies.
In the Southern Hemisphere we have similar processes where winds move from High towards Low pressure, and then are deflected by the Coriolis Force (to the left of direction of motion in the Southern Hemisphere). In the three wind zones will have the following: 0°-30°S: Southeast Trade Winds, 30°-60°S: Westerlies, and 60-90°S: Polar Easterlies.
Hadley Cells
Finally, we can consider how air moves vertically and circulates within our three wind zones (per hemisphere). Between the equator and the horse latitudes, we see a cross section of the Hadley cell shown in the idealized model. Due to the high levels of shortwave radiation received at the equator Low pressure forms, causing the air to rise to the tropopause. At the tropopause, the air “fans out” in both directions towards the poles and continues poleward at the top of the troposphere. At 30° latitude, the air begins to sink back to the surface and then “fans out” in both directions. The portion of that sinking air at moves back towards the equator completes the Hadley Cell. The portion of the sinking Sub-Tropical High air that moves towards the pole starts the second type of cell: the Ferrel Cell. This poleward moving air is forced upwards at the Polar Front and will similarly “fan out” in both directions in the troposphere, completing the Ferrel Cell cycle.
Concept Check# 1
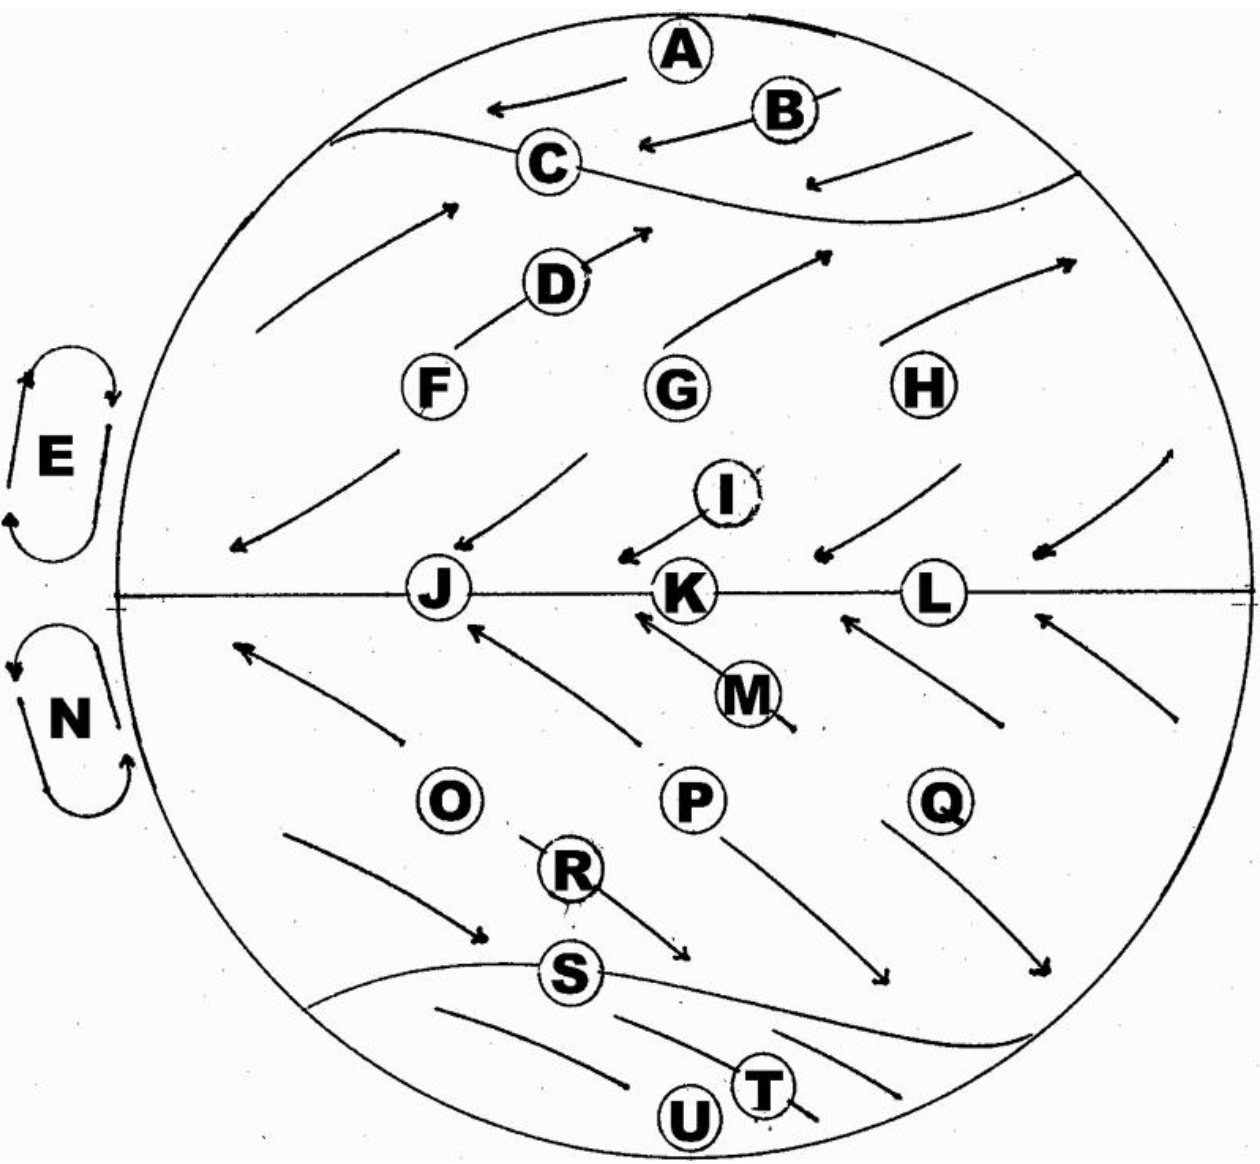
Using the following labeled diagram of the Earth (Figure 7-2), where wind fields are shown with arrows, identify the locations of (a) Horse Latitudes, (b) Polar Highs, and (c) Northern Hemisphere Westerlies. Be sure to select all answers that match the locations and separate your answers with a comma (example: A, B, C, D)
Local-Scale Circulations
In addition to the prevailing wind directions that come with general circulation, there are also many smaller-scale processes and features that influence atmospheric circulation at regional and local scales. These might be areas of topographic variability, land cover differences, or even the presence of man-made structures. We will briefly explore Land- and Sea-Breezes, Mountain- and Valley-Breezes, and Katabatic Winds.
Sea-Breeze and Land-Breeze
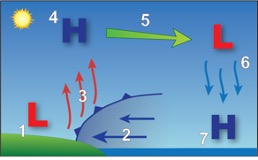
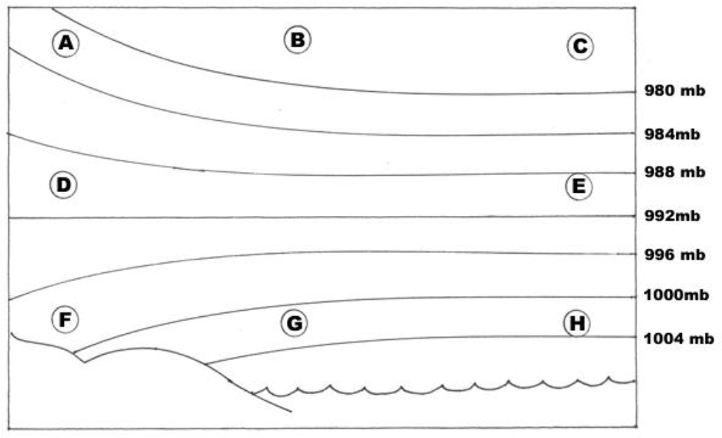
These localized circulations occur as a result of differential heating of land and water surfaces, where the water takes more energy to warm and cool compared to the land surface. During the day, the land and water will absorb shortwave radiation from the Sun, but the land will warm up faster. Air in contact with this warming land will warm, and this warming air will expand the air column over the land. This causes horizontal pressure gradients to form at the surface and aloft that results in winds moving from the sea into towards land: a sea-breeze. Note how in the diagram you have rising air inland and sinking air off shore associated with sea-breezes (Figure 7-3).
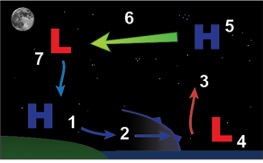
At night, we see the opposite occurring with the land cooling more quickly than the water. Thus the air inland becomes cooler than the air off shore and generates a pressure gradient that at the surface pulls air from the land out to the water: a land breeze. In this case, air above the land is sinking and air above the water is rising (Figure 7-4).
Concept Check #2
Based on the image below that represents the east coast of Delaware during a clear summer afternoon, which way is the air moving at location G (Figure 7-5)?
- (a) From left to right (from land to sea)
- (b) Rising
- (c) Sinking
- (d) From right to left (from sea to land)
Mountain Breeze and Valley Breeze
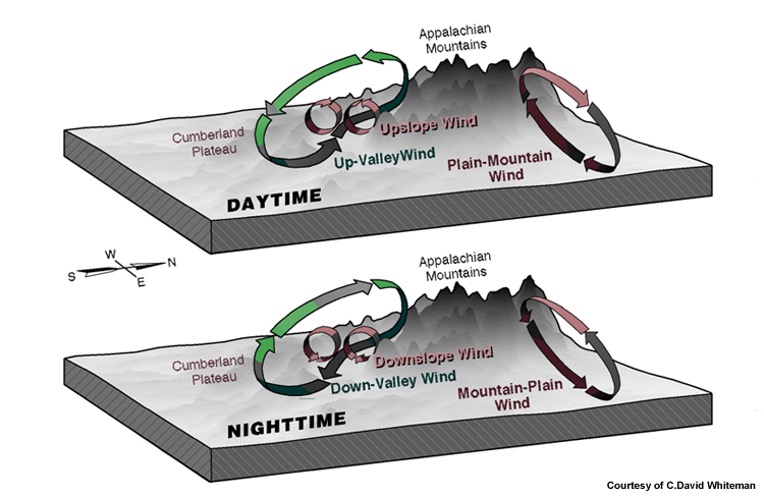
Another localized wind is that of mountain and valley breezes. These result from the differential heating of the surface at different elevations within mountainous environments. During the day, the mountain slopes are warmed more yielding low pressure and less dense air that gently rises upslope. This upslope breeze is called a Valley Breeze. The opposite results at night, where the mountain slopes cool quickly, generating high pressure and more dense air that flows downslope: Mountain Breeze (Figure 7-6).
Katabatic Winds
The final localized wind we will explore today is the Katabatic Wind. This refers to any downslope wind, but the term is generally used for winds that are much stronger than mountain breezes. At the top of the slope, often on a large plateau, the air is significantly colder than the air below. This colder air typically forms due to the presence of snow cover on the plateau, resulting in higher pressure on the plateau. The colder, denser air begins to flow downslope due to the pressure gradient that forms between the high pressure on the plateau and the relatively lower pressure downslope. As the flow downslope, the winds are often channeled into relatively narrow passes or canyons and can result in hurricane-force wind speeds.
You’ll recall from our discussions of adiabatic processes that as air sinks (i.e., flows downslope) it will compress and warm, resulting in a progressively warmer air parcel with a lower relatively humidity as it sinks. As such, Katabatic Winds can pose a real danger to environments and people in their path in the form of rapid snowmelt and wildfire risk. Different types of Katabatic Winds include Chinook Winds and Santa Ana winds. Chinook Winds are marked by warm, dry air that flows down the eastern slopes of the Rocky Mountains and often can melt snow extremely rapidly (over a foot in a day). Santa Ana winds flow downhill from the E or NE into the Los Angeles Basin and San Fernando Valley in California, originating in the high deserts of Nevada and southern California. These winds are often associated with high or very high fire risk.
Concept Check #3.
True/False. All Katabatic Winds are Mountain Breezes.
Large-scale Modes of Atmospheric and Oceanic Variability (Teleconnections)
Within the climate system, there exist a number of large-scale interactions between the atmosphere, land-surface, and ocean that can influence weather across the planet. Many of these interactions oscillate back and forth between distinct phases over varying lengths of time, where often there are different meteorological impacts associated with each phase. These interactions and corresponding meteorological influence are called Teleconnections, and there are many of them including the North Atlantic Oscillation (link), the Pacific Decadal Oscillation (link), amd the one we will focus on here: the El Nino Southern Oscillation.
El Nino Southern Oscillation (ENSO)
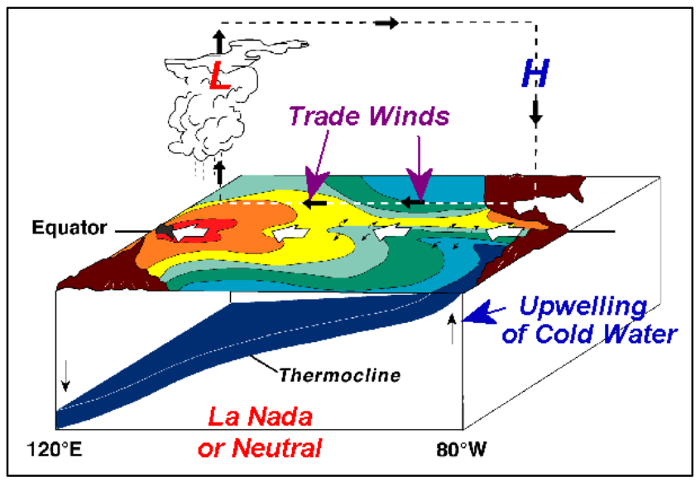
ENSO is one of the most prominent teleconnection indices, and is associated with equatorial sea surface temperatures in the Pacific Ocean. ENSO has three distinct phases that occur over a period of three to seven years on average. The first phase is that of neutral (Figure 7-7). Here, trade winds blow from east to west along the equator as is normal based on general circulation. Off the western coast of South America, these trade winds result in the upwelling of cold (and nutrient rich) water from the ocean depths to the surface. To the west near Australia, ocean waters are warmer and this warmer water results in additional convection and precipitation in this region.
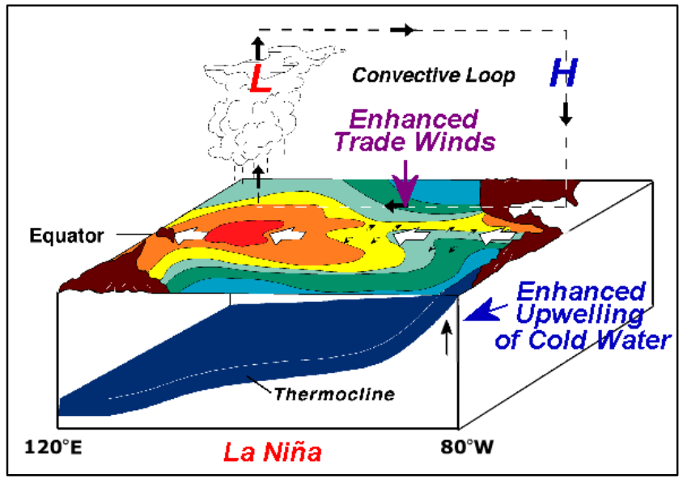
The second phase is that of La Nina (Figure 7-8) This can be considered as the neutral conditions on overdrive. The easterly trade winds strengthens and results in more upwelling that extends the area of cold sea surface temperatures further west. In western South America, conditions are very dry, while in eastern Australia and the surrounding region, there is additional ocean warming and atmospheric convection (and precipitation) leading to rainy conditions and flooding.
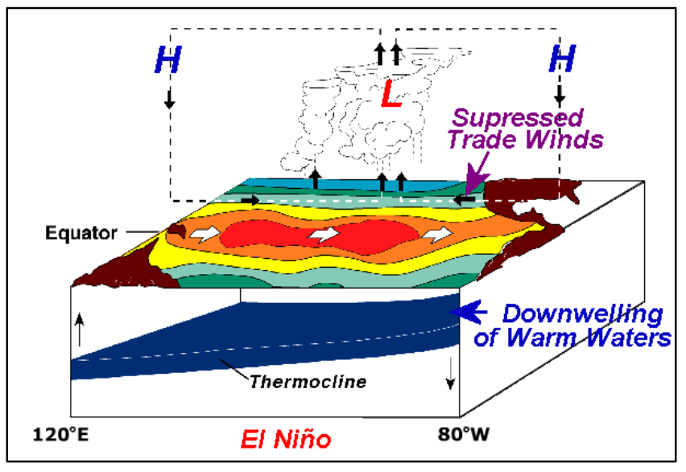
The third phase is that of El Nino (Figure 7-9). Here, the trade winds weaken and can reverse (moving west to east). This inhibits the usual upwelling of cold ocean water along the western South American coast and results in warm waters being pulled east across the equatorial Pacific. As the warm waters move east, so to do the areas of enhanced atmospheric convection and precipitation, influencing regions of drought and excessive moisture across not just the region, but the entire planet.
Concept Check #4
Under normal conditions, ocean temperatures in the equatorial Pacific are:
- (a) Cool in the east and warm in the west
- (b) Warm in the east and cool in the west