5 Lab #5: Cloud Development and Precipitation
Lab #5
Zachary J. Suriano
Introduction and Objectives
As we have introduced before, clouds are involved in both the hydrologic and energy balances with the Earth system. Depending on their composition, ice or liquid, clouds can increase the amount of longwave radiation that is absorbed and re-radiated back towards the surface or reduce the amount of shortwave radiation that reaches the surface. Clouds are also a required component of precipitation. In this lab, you will explore the processes that lead to cloud development and different types of precipitation.
Specific learning objectives of this lab are to:
- Apply understanding of adiabatic lapse rates to determine air parcel temperatures with height.
- Calculate the lifting condensation level from surface conditions.
- Analyze atmospheric profiles through Skew T Log P diagrams.
- Differentiate types of precipitation based on their characteristics and vertical profiles.
Adiabatic Lapse Rates
Adiabatic processes are unique in that you can get a change in the temperature of an air parcel without the transfer of heat. When a parcel rises, it encounters an environment with lower pressure. With lower pressure, there is less force being applied on the parcel by the atmospheric environment. Thus the parcel will expand, doing work on the environment. This cools the temperature of the parcel (the molecules are now moving slower). When an air parcel rises, it will expand and cool adiabatically. In reverse, when a parcel sinks it encounters an environment with higher pressure. The environment does work on the parcel, causing the parcel to compress, leading to a warmer parcel temperature. When an air parcel sinks, it will contract and warm adiabatically.
There are specific rates at which air parcels will change temperature as the rise and sink. These rates are called Adiabatic Lapse Rates, and are based on a parcel being saturated or unsaturated. When the parcel is unsaturated (i.e., less than 100% relative humidity), the parcel will change temperature by 1.0°C per 100 meters. When the parcel rises, the temperature will decrease. When the parcel sinks, the temperature will increase. This is called the Dry Adiabatic Lapse Rate.
When the parcel is saturated (i.e., 100% relative humidity), the parcel will change temperature by 0.6 °C per 100m. This is called the Moist Adiabatic Lapse Rate (sometimes called the Wet Adiabatic Lapse Rate). The Moist Adiabatic Lapse Rate will always be less than the Dry Adiabatic Lapse Rate (i.e., a slower change in temperature with height). This is because some of the adiabatic cooling that occurs as the parcel rises is offset by the latent heat that is released via condensation. While this rate does vary based on how much water vapor is present, we will use 0.6°C per 100 meters as the average value.
Note: when air sinks, the temperature increases. You’ll recall that as temperature increases, relative humidity decreases. Therefore, sinking air can’t be saturated. If the parcel is sinking, the Dry Adiabatic Lapse Rate will always be used for calculations.
Consider the following situation. An unsaturated air parcel with a temperature of 18.4°C at the surface is lifted to an elevation of 2100 meters. What is the temperature of the parcel at that new height?
To solve this, we first need to determine what lapse rate (or rates) we will need. The question indicates the parcel is unsaturated to start. We are not given any additional information about the amount of water vapor in the air, nor does the question indicate the parcel becomes saturated as it rises. Thus, the parcel will stay unsaturated, and we need to use the Dry Adiabatic Lapse Rate (1.0°C per 100 meters).
Next, we need to know how far the parcel travels. The question says 2100 meters.
Step three is to calculate the change in temperature for that height based on the lapse rate. For every 100 meters lifted, the parcel will cool by 1.0°C. The parcel moved 2100 meters, so we multiply out:
( 1°C / 100m ) x 2100 m = 21°C
Note how the units of “m” cancel out within the fraction, and you are left with units of °C.
The final step is to calculate the resulting temperature. The parcel started at a temperature of 18.4°C and then proceeded to cool by 21.0°C.
18.4°C – 21.0°C = -2.6°C
Concept Check #1
An air parcel with a temperature of 30.1 °C rose 1000m and became saturated. The parcel continued to rise another 1000m. What would its final temperature be?
Concept Check #2
A saturated air parcel with a temperature of -20.5°C sinks from an elevation of 2650 meters to 1225 meters. What is its temperature at this new level?
Lifted Condensation Level
The level, or height, in the atmosphere when a lifted air parcel reaches saturation (i.e., relative humidity equals 100% and the air temperature equals the dew point temperature) is called the Lifted Condensation Level, or LCL. Any additional lifting beyond the LCL will result in condensation and cloud formation. Thus, we consider the LCL to be the base of the clouds. We can estimate the LCL based on the following formula:
LCL (in meters) = 125 meters x Dew Point Depression (in °C)
Recall, the dew point depression is the difference between the air temperature and the dew point temperature of a parcel. E.g., If the temperature was 25°C and the dew point was 15°C, the dew point depression would be 10°C. In that case, the LCL would be:
LCL = (125 meters) x (Dew point depression)
LCL = (125 meters) x (10)
LCL = 1250 meters
Concept Check #3
Use the following conditions from the KY Mesonet station at WKU’s Ag Farm to determine the LCL at different days from last year. Round to the nearest whole number.
| Day and Time | Temperature (°C) | Dew Point Temperature (°C) | LCL (m) |
| 10am, May 9th | 21.6 | 18.5 | |
| 3pm, April 9th | 20.0 | 0.2 | |
| 4:30pm, April 20th | 28.7 | 8.2 |
Vertical Profiles of Stability (Skew-T Log-P Diagrams)
In class we will spend time examining conditions of absolute instability, absolute stability, and conditional instability that are based on when the environmental lapse rate (the actual change of temperature with height) is greater or lesser than the DALR and MALR. Using a special diagram we can quickly examine the atmosphere and determine how stable or unstable the atmosphere is at different levels. This gives us an indication for the potential for cloud and storm formation. Such graphs are Skew T Log P diagrams.
How to read a Skew T
As the name implies, your two main axes are T: temperature, and P: pressure. Temperature values are shown along the X-axis, typically with every 10°C marked, with higher temperatures to the right. The difference from a normal graphic is that these (blue) temperature lines do not extend directly up the graph, but are skewed, or tilted, to the left at an approximate 45° angle. The Y-axis is atmospheric pressure, with higher pressure towards the bottom and lower pressure towards the top, with markings every 100mb typically. Instead of being equally spaced out, the pressure values are on a log scale, meaning they are compressed a bit towards the bottom of the graph. (blue) Lines of pressure stretch left to right across the graph (Figure 5-1).
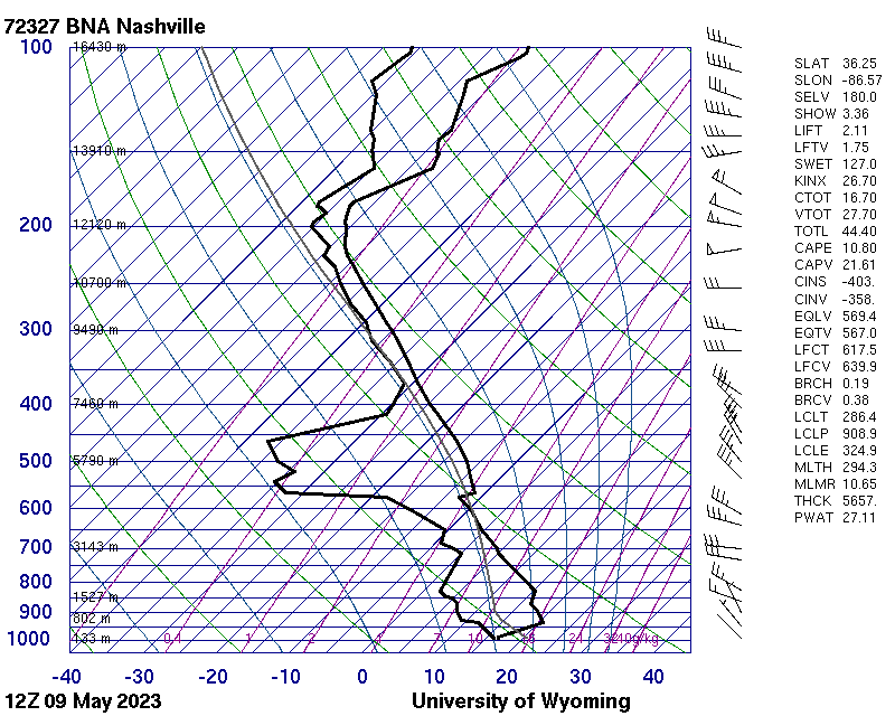
Next to the pressure values (just to the right of the Y-axis) you will find elevations in meters. These values correspond to how high up in the atmosphere you have to go to reach that specific pressure value. On the right hand side, you will see a few other pieces of information. For our purposes, you can ignore these. But, if you are curious the following weblink contains the various parameters and indices they represent: https://weather.uwyo.edu/upperair/indices.html Also on the right hand side are a series of wind barbs. These indicate the wind direction and speed (just like a station model) at different elevations.
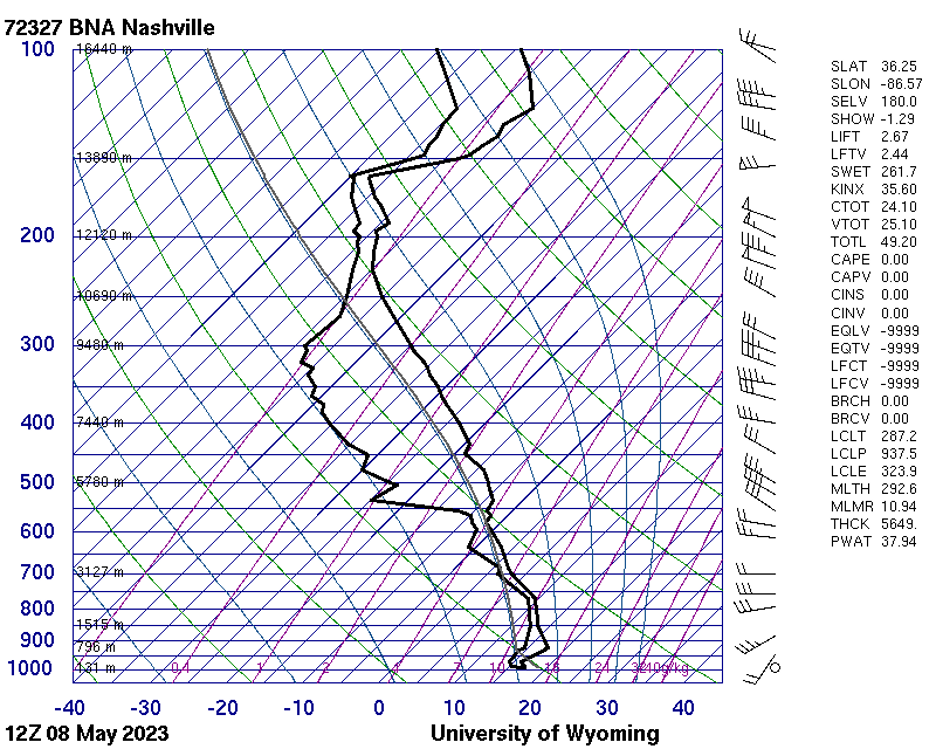
On the graph itself, you will see two thick black lines. The thick black line to the left is the dew point temperature of the air at each point in the column, while the one to the right is the air temperature. By examining these lines, we can determine the temperature and/or dew point temperature at various points in the atmosphere, while also estimating relative humidity, the likelihood of clouds and precipitation. Below is a Skew T from Nashville.
From this Skew T we can determine:
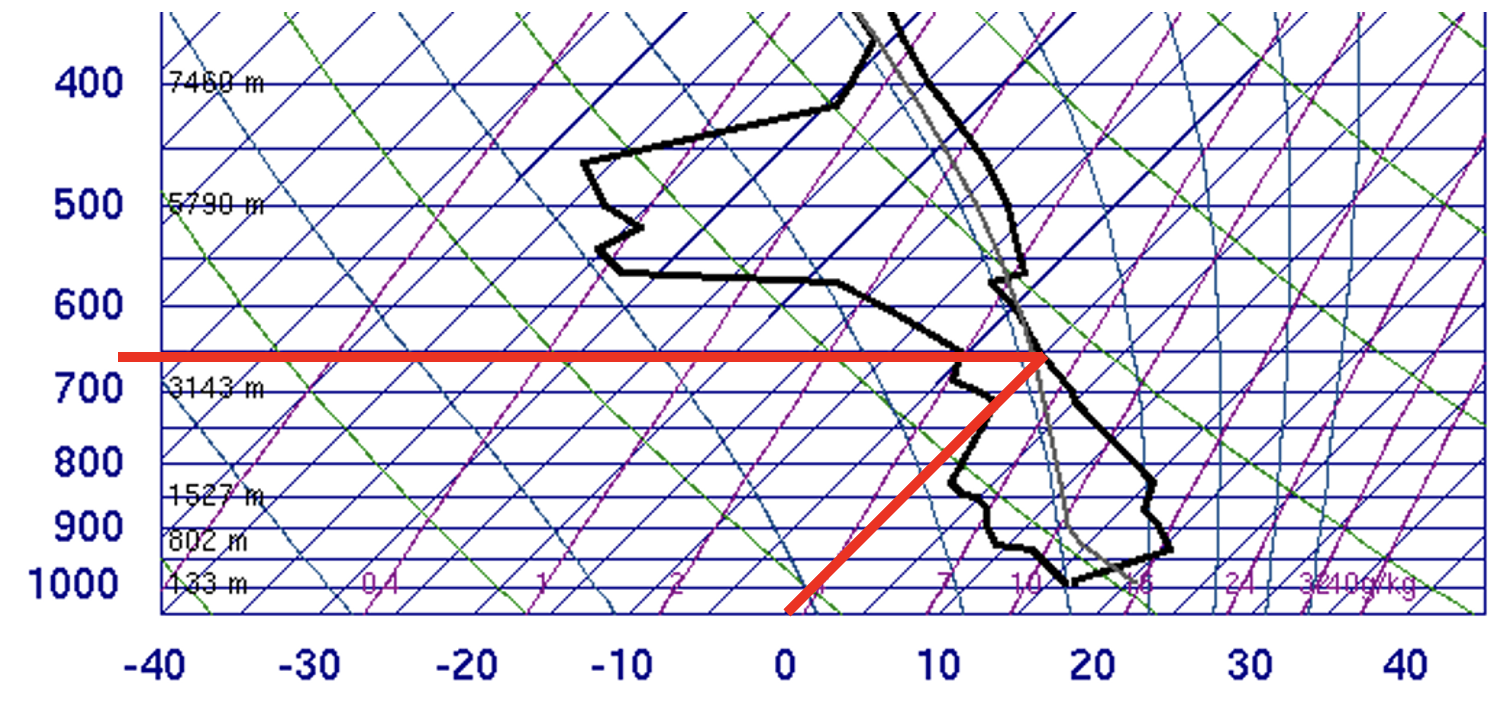
(a) The pressure value where the atmosphere first drops below freezing. We do this by first finding the freezing point on the x-axis (0°C) and moving up the line until it intersects with the thick black line that represents actual temperature with height (not the dew point line). Then we move across to the pressure and/or height values on the left and read the value. If it is between two values, you will need to interpolate. In this case, 0°C temperatures are observed around 650 mb (Figure 5-2).
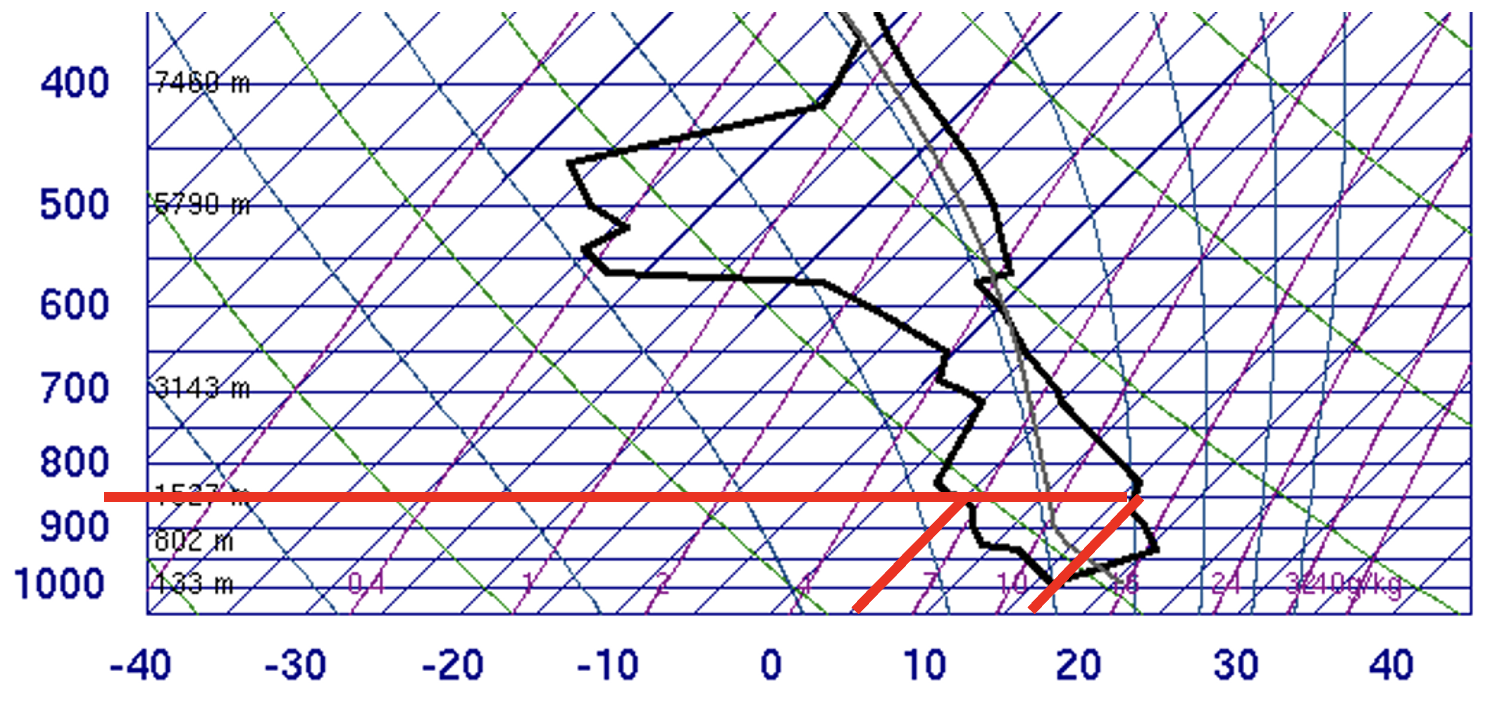
(b) The temperature and dew point at a specific point in the atmosphere: 850 mb. We do this by doing the previous exercise in reverse (figure 5-3). First starting from the pressure value and going across to the points where it intersections the dew point and temperature lines. At 850 mb, the dew point (left black line) is approximately 5°C. The temperature (right black line) is between 15 and 20°C. It is closer to the 15 than the 20, thus answer answer of 16 or 17°C is appropriate.
(c) Finding areas of high or low relative humidity. We do this by evaluating how close the temperature and dew point lines are to each other. Layers of the atmosphere when the lines are closer together indicate higher relative humidity. If the lines are overlapping then the air is saturated and clouds are likely. The thicker the layer of atmosphere there is with overlapping (or very close) temperature and dew points, the greater the likelihood there is for precipitation. Some quick guidelines on precipitation identification from a Skew T:
-
- If the temperature is < 0°C through the saturated thickness, snow is likely.
- If the temperature is > 0°C below the level of 850 mb, rain is likely.
- If there is a temperature inversion above a below freezing layer, freezing rain is likely.
- The thickness of this below freezing layer determines the potential for sleet, with the thicker the layer the more likely sleet will form.
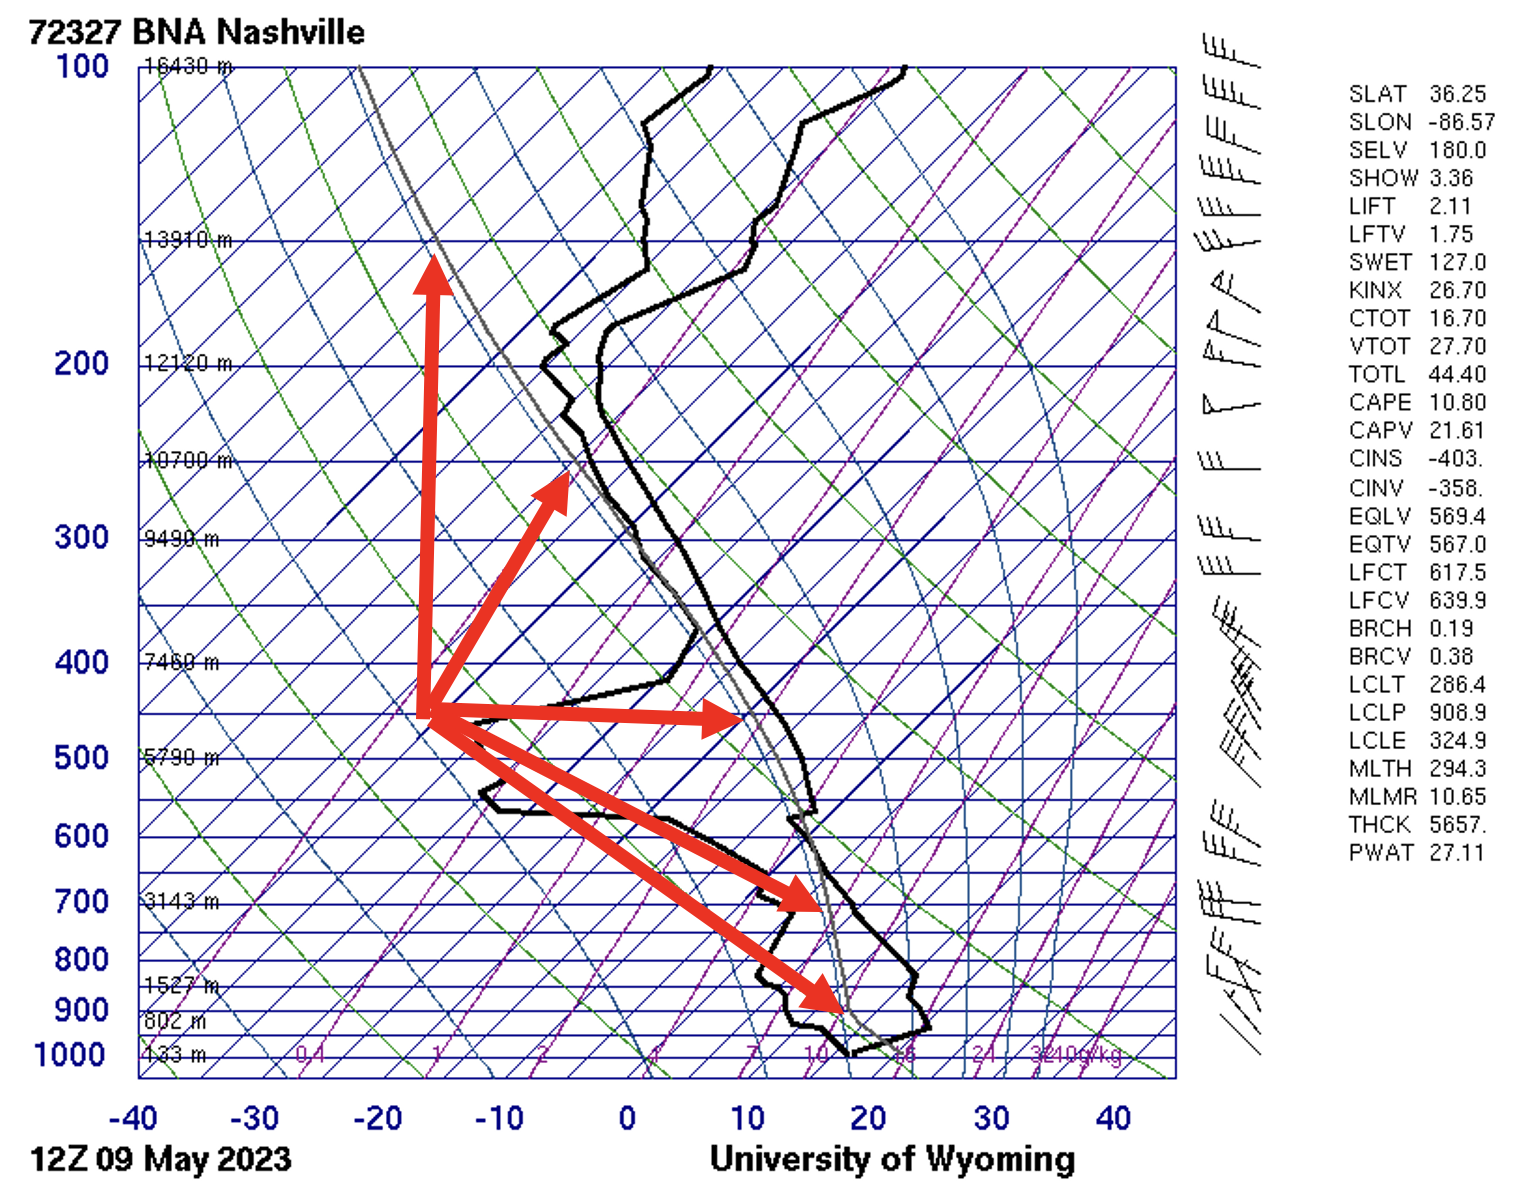
Finally, on the Skew T is a relatively thin grey (sometimes red) line that gives an indication of the stability of the atmosphere. The line is pointed out below. This is the theoretical line of what an air parcel’s temperature would be if it was lifted through the atmosphere. By comparing this line to the temperature of the surrounding air (thick black line), we can determine stability.
- If the air temperature of the surrounding air is warmer than the parcel temperature, this indicates absolute stability. It is visualized by the parcel line being to the left of the temperature line. This means any lifted air will be cooler than its surroundings and want to sink back towards the surface. The further to the left the parcel line is from the temperature line, the more stable the situation is.
- If the air temperature of the surrounding air is cooler than the parcel temperature, this indicates absolute stability. It is visualized by the parcel line being to the right of the temperature line. This means air will continue to rise on its own even if the original force lifting the parcel is removed. The larger the area between the parcel line and black temperature line (further to the right), the more unstable the situation.
- If the parcel line is to the left of the black temperature line from the surface upwards to some level, but then crosses over to the right side of the black temperature line above that crossing point, this indicates conditional instability. The parcel will sink back towards the surface if the uplift mechanism stops before the crossing point, but once it reaches that crossing point, it will continue to lift on its own.
The example we have been looking at (below; Figure 5.4) represents nearly all stable air, with the exception of a very narrow region around 575 mb.
Concept Check #4
Given the Skew T shown below: (figure 5-5).
- At what pressure value is the air temperature equal to -10°C?Round your answer to the nearest 25 mb.
- At which level is the relative humidity greater, 400 mb or 700 mb?
- Would you consider this atmospheric profile to be stable, unstable, or conditionally unstable?
- What type of precipitation do you expect?
Precipitation Processes
Depending on if the cloud is primarily a warm (above freezing) or cold (below freezing) cloud, different precipitation processes occur. In warm clouds, cloud droplets grow into rain droplets via the Collison and Coalescence process. As the name suggests, droplets will collide with each other as they fall, and merge (or coalesce) into a larger and larger droplet. As the droplets grow, they become heavier and fall faster. Still within the cloud, the larger droplet will begin to encounter air resistance, causing them to break apart into smaller droplets and the process begins again but with more and more droplets. Eventually, these droplets fall out of the cloud and can reach the surface as rain.
In cold clouds, there are both ice crystals and supercooled water droplets (liquid droplets that are less than 0°C), and these processes are a part of the Ice Crystal process. Because ice has a lower saturation vapor pressure, ice crystals will grow at the expense of liquid droplets, where the liquid evaporates to water vapor, and the water vapor deposits on the ice crystal causing it to grow. In cold clouds, most of the precipitation leaving the cloud is in the form of snow, and then can either remain as snow down to the surface, melt and reach the surface as rain, or reach the surface as sleet or freezing rain if there is sufficient cold layers and an inversion at lower levels. Sleet results from the melted crystal refreezing in the atmosphere before reaching the surface. In these cases, the freezing layer beneath the inversion being relatively thick, given sufficient time for refreezing to occur. Sleet looks like a small ice pellet. Freezing rain, in comparison, reaches the surface as liquid, but freezes on contact forming a sheet of ice. The freezing zone below the inversion is relatively narrow for freezing rain, preventing the droplet from refreezing on the way down from the cloud like what happens with sleet.
Concept Check #5
Compared to smaller drops, large rain drops fall _______.
(a) Slower
(b) Faster
(c) The same speed