10 Lab #10: Thunderstorms and Tornadoes
Lab #10
Zachary J. Suriano
Introduction and Objectives
Some of the most exciting, and dangerous, meteorological phenomena are associated with thunderstorms, including lightning, hail, severe winds, and tornadoes. This lab will focus on some of the climatological and safety dimensions of these features, while also complimenting some of the more theoretical and formation-based topics emphasized in lecture. In addition to the information contained within the lab, there is a wealth of information available from other sources, including NOAA and the NWS. The “Preparedness Guide” linked below is worth reviewing from a safety perspective: https://www.weather.gov/media/owlie/ttl6-10.pdf
Specific learning objectives of this lab are to:
- Differentiate types of thunderstorms.
- Calculate distance based on visualization of lightning and subsequent hearing of thunder.
- Describe when and where thunderstorms and various severe weather outcomes occur from a climatological perspective.
- Interpret convective outlooks.
- Identify some of the key features of tornadic environments.
Thunderstorms
Types of Thunderstorms
A simple way to think of a thunderstorm is any type of storm that generates lightning, and thus thunder. They are convectively driven, meaning they initiate typically from warm and moist air that is forced upward from one of a number of possible uplift mechanisms (e.g., unequal heating of the surface, topography, frontal boundary, upper level divergence, etc.). Five primary types of thunderstorms exist: (a) air mass (or ordinary), (b) multi-cell, (c) squall lines, (d) supercells, and Mesoscale Convective Complex (MCC). The following spotter guide can be helpful in differentiating the types: https://www.weather.gov/spotterguide/types
(a) Air mass Thunderstorms
These are the weakest storms with only a single cell. They have a life cycle of about 30 to 60 minutes due to the resulting downdraft dominating throughout much of the cloud after formation (Figure 10-1). This downdraft inhibits upward motion in just a relatively short period of time. The figure below showcases the three primary life cycle stages of air mass thunderstorms: (1) cumulus stage where the cloud is rapidly growing, (2) the mature stage where updrafts and downdrafts exist together and the storm can result in heavy precipitation, and (3) the dissipating stage where the downdraft dominates and begins to cut off the storm from the warm and moist air needed for convection.

(b) Multi-cell Thunderstorms
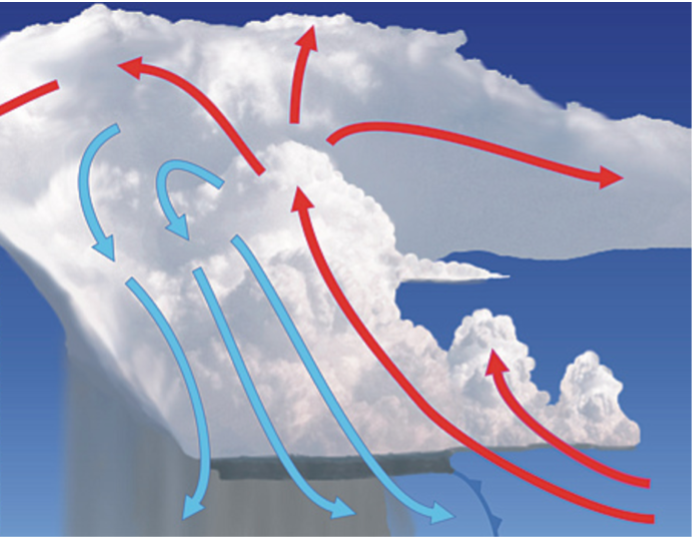
These types of storms have multiple storms, or cells, that are progressing through the stages above at different rates. While each cell behaves like a single air mass thunderstorm, the collective nature of the cells forming new ones upwind results in a new thunderstorm type designation. What makes this unique from air mass thunderstorms is that there is moderate-to-strong vertical wind shear present such that wind speeds are faster at higher levels of the atmosphere. This results in the thunderstorms tilting and allows for the updraft and downdraft to not directly compete with each other in the same vertical space (Figure 10-2). By not directly competing, multi-cell thunderstorms can persist for longer periods of time without being cutoff from the warm and moist air at the surface. Often, the leading gust front (caused by the cold air within the downdraft spilling out along the surface) can initiate the next cell that give multi-cell thunderstorms their name. The image to the left showcases the tilted nature of the thunderstorm’s updraft and how the gust front helps initiate the next cell in the multi-cell thunderstorm.
(c) Squall Lines
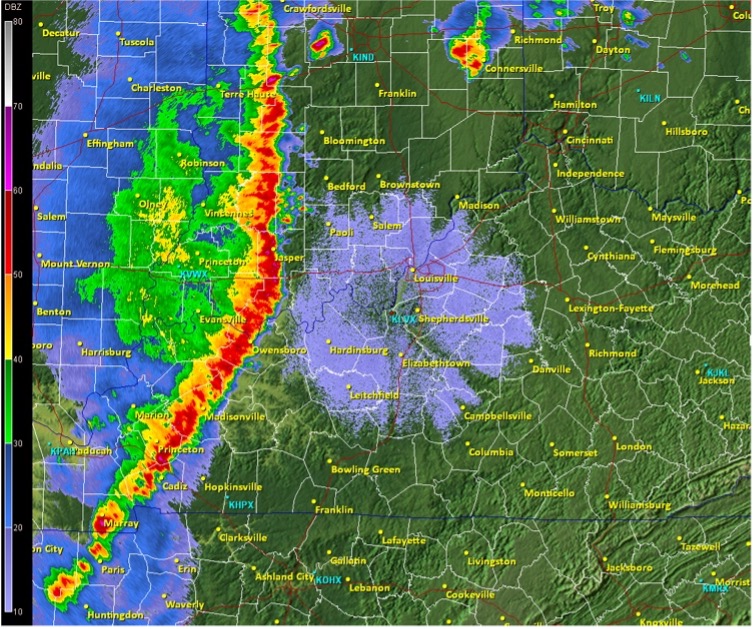
This is a type of multi-cell thunderstorm that form an extensive line, potentially along a cold front, that can be hundreds of miles long but typically are only 10-20 miles wide. Squall lines (Figure 10-3) can generate long-lived severe weather, most often in the form of straight-line winds and hail, but tornadoes can occur. If a squall line is particularly long-lived, it may meet the definition for a derecho. A derecho, by definition, results in straight-line winds for more than 240 miles with wind gusts of at least 58 mph.
(d) Supercells
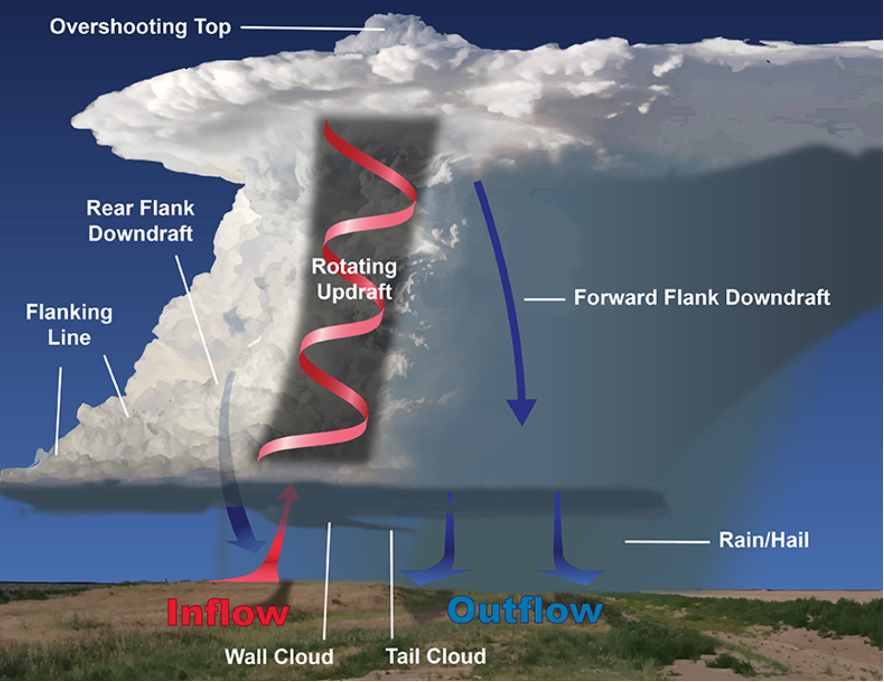
The defining feature of a supercell is a rotating updraft (Figure 10-4). This rotation allows a supercell to persist for many hours, where updrafts of over 100 mph are possible, and can generate some of the world’s most violent tornadoes; about 30% of supercells produce tornadoes. The structure of a supercell is distinct from that of the other thunderstorm types, where beyond the rotating updraft, there are flanking lines that merge into the updraft and promotes longevity of the storm. The figure on the following page highlights some of the important features of supercells, including the Rear and Forward Flank downdrafts. Further details on these features are available at https://www.weather.gov/spotterguide/supercell2 and https://www.weather.gov/spotterguide/supercell1, among various other locations.
(e) Mesoscale Convective Complex (MCC)
MCCs are a type of Mesoscale Convective System (MCS), where MCSs are a collection of thunderstorms that act together as a larger system. These are large compared to the other thunderstorm types, and can last more than 12 hours. MCCs, specifically, can be very large (as much as 1000 times larger than air mass thunderstorms), with some MCCs being large enough to cover an entire state. MCCs most often form during the summer and where upper level winds are weak. The weak winds results in MCCs moving relatively slowly and thus can generate excessive amounts of precipitation and cause flash flooding.
Concept Check:
Which type of thunderstorm is best characterized by individual cells at different stages of development with a tilted updraft?
(a) Air mass thunderstorm
(b) Multi-cell thunderstorm
(c) Squall line
(d) MCC
(e) Supercell
Thunderstorm Climatology
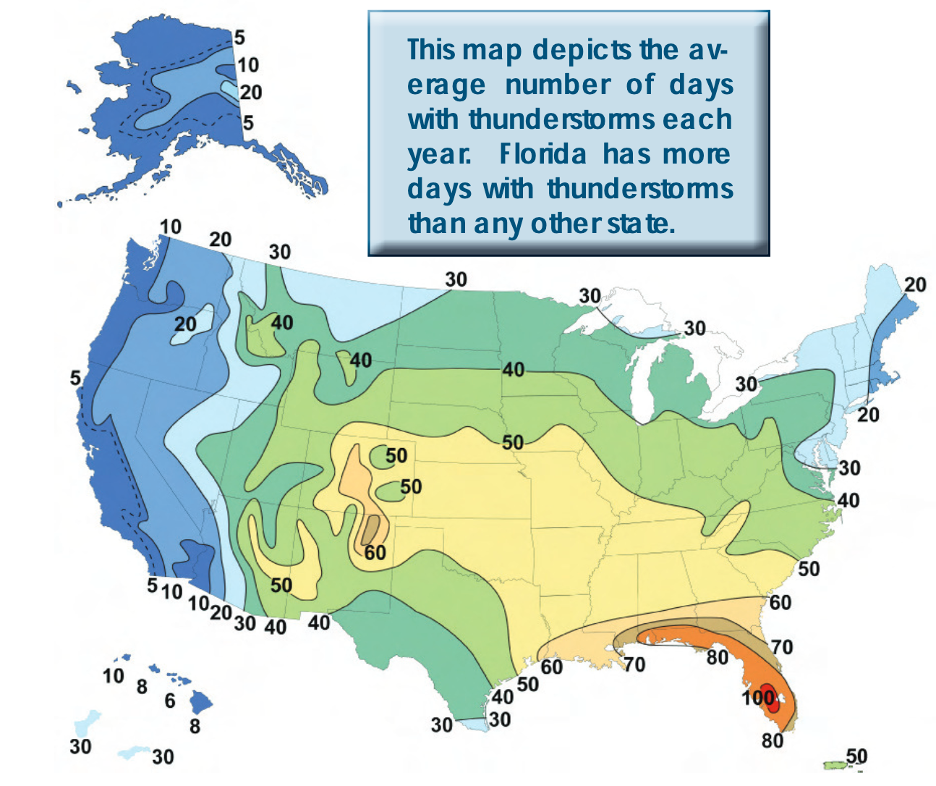
Thunderstorms are relatively common across the large swath of the U.S. from the front range of the Rocky Mountains through into the southeast. Highest thunderstorm frequency is observed in Florida, where areas outside of Orlando experience a thunderstorm approximately once every three to four days, on average (Figure 10-5). Bowling Green, KY averages about one thunderstorm every week, however they are more common in the spring and summer, compared to fall and winter. Thunderstorms are most common in the afternoon and earlier evening hours, at the end of the radiative surplus, but can occur at any time of day. If you are interested, Blakeslee et al. (2014) presents a comprehensive look at seasonal variations in lightning during the diurnal cycle (https://doi.org/10.1016/j.atmosres.2012.09.023).
Concept Check:
Approximately how many days per year do thunderstorms occur in Chicago, IL?
Lightning
Lightning is what makes a thunderstorm a thunderstorm. It is the electrical discharge of energy caused by charge separation within clouds containing frozen precipitation and ice crystals. Collisions between rising and falling crystals within the cloud result in positive charges moving into higher portions of the cloud with negative charges moving into lower potions of the cloud. If and when the difference in charge between the top and bottom of the cloud, or the cloud and the surface becomes too great, a channel of air develops that tries to connect their positively and negatively charged areas. When they connect, the energy is discharged rapidly. This discharge is a flash of lightning. Dozens of people in the U.S. die from lightning each year, with typically another 300-500 injuries. While your odds of being struck by lightning are relatively low (about 1:600,000), following safe practices can reduce your odds even further. The easiest strategy to be indoors. Consult the previously linked Preparedness Guide for more information.
Thunder
The channel of air that lightning passes through during discharge becomes super heated to nearly 50,000°F. This is five times hotter than the surface of the sun. The heating of that air causes it to expand, rapidly, resulting in a sound wave we know as thunder. Because light and sound travel at different speeds, we can use the time lag between when we see lightning to when we hear thunder to calculate approximately how far away the lightning strike was. For each second between seeing lighting and hearing thunder, the lightning was approximately 1/5th of a mile away. Thus if 5 seconds go by between the lightning sighting and hearing thunder, the lighting was 1 mile away. A good guideline with respect to lightning safety is that you hear thunder the lightning is close enough to be dangerous and you should seek shelter immediately.
Concept Check
If you see a lightning strike and it takes 18 seconds for you to hear thunder, approximately how far away are you from the lightning?
Convective Outlooks
The Storm Prediction Center provides daily outlooks for the probability of severe weather across the U.S. for the current day through 8 days out. For Day 1, 2, and 3 Outlooks, a map is provided that depicts areas of potential non-severe thunderstorm activity and severe thunderstorm activity, along with a descriptive text. Severe thunderstorm risk is communicated through categories spanning 1 (Marginal Risk) to 5 (High Risk), corresponding to the probabilistic forecast of a severe weather event occurring within 25 miles of a forecast point. Below are what each of the categories mean and with the corresponding color on the map.
TSTM (light green) – general of non-severe thunderstorms – 10% or greater probability for thunderstorms
1-MRGL (dark green) – Marginal Risk – An area of severe storms of either limited organization and longevity, or very low coverage and marginal intensity
2-SLGT (yellow) – Slight Risk – An area of organized severe storms, which is not widespread in coverage with varying levels of intensity
3-ENH (orange) – Enhanced Risk – An area of relatively greater (compared to SLGT) severe storm coverage with varying levels of intensity
4-MDT (red) – Moderate Risk – An area where widespread severe weather with several tornadoes and/or numerous severe thunderstorms is likely, some of which should be intense. Typically reserved for days with several supercells producing intense tornadoes and/or very large hail, or intense squall line.
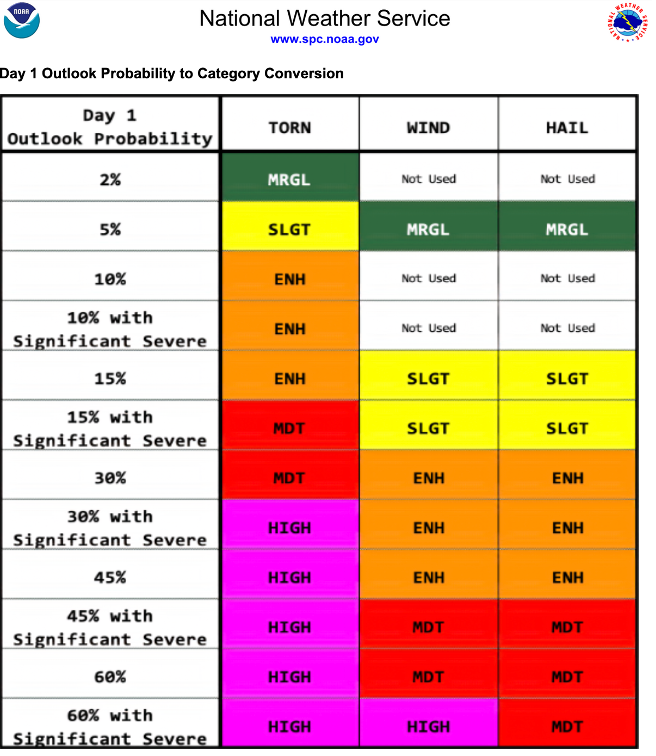
5-HIGH (magenta) – High Risk – An area where a severe weather outbreak is expected from either numerous intense and long-tracked tornadoes ro a long-lived derecho-producing thunderstorm complex. Reserved for when high confidence exists in widespread coverage of severe weather with embedded instances of extreme severity. Figure 10-6 shows how the probabilities for tornadoes, wind, and hail are translated into the Outlook. Similar graphics exist for Day 2 and Day 3. With days 4-8 presenting more limited information.
Concept Check
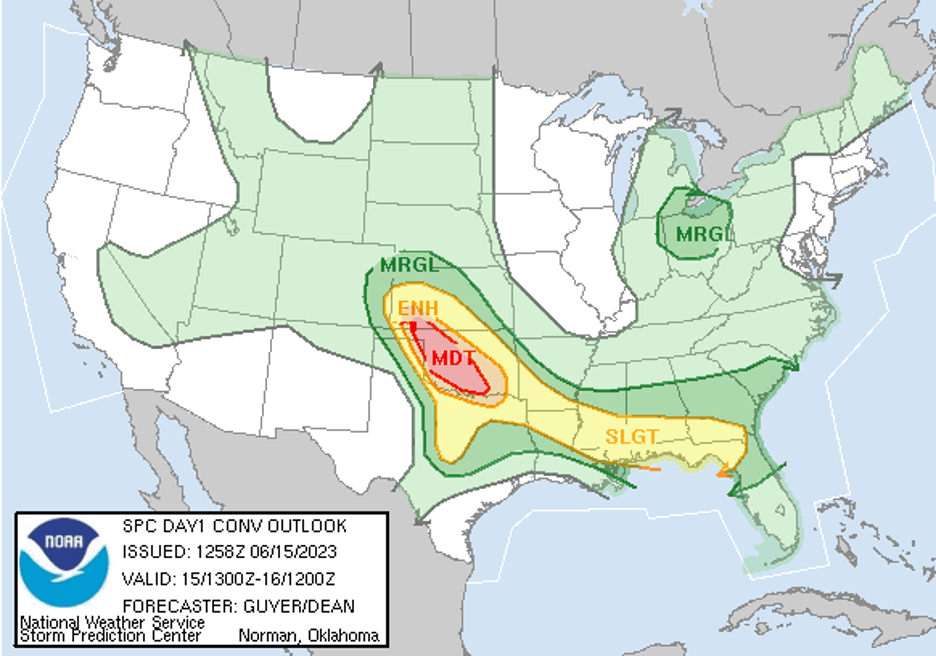
Using the Convective Outlook from June 15, 2023 (Figure 10-7),
(a) Indicate which states are under enhanced risk for severe weather. List the state(s) in alphabetical order and include all states that have any amount of risk in that category.
(b) What risk in central and eastern KY under on this day?
Tornadoes
Tornadoes occur more frequently in the U.S. than anywhere else in the world, with some 1,250 tornadoes occurring each year on average. This lab will briefly summarize some of the content covered in lecture, including how tornadoes form and how they are rated by intensity, but also expand on the climatology of when and where tornadoes occur. Below is a graphic summarizing the basic tornado formation process, where an area of horizontal rotation is tipped vertically (Figure 10-8).

Tornado Intensity Scale
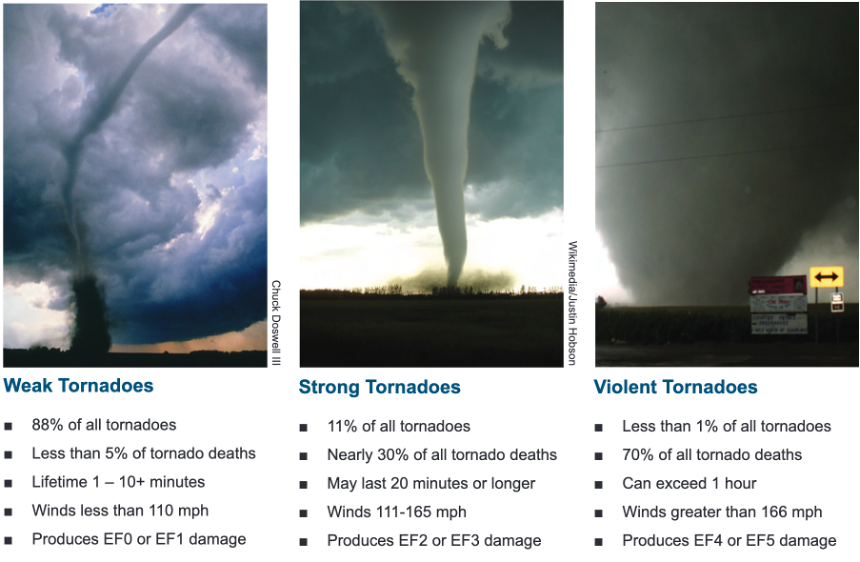
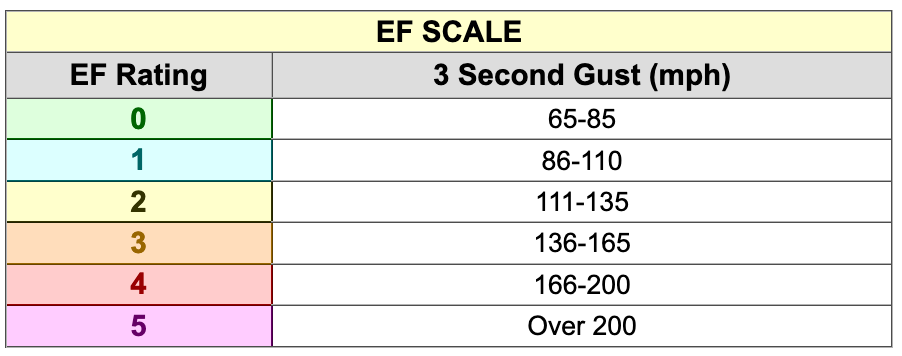
Tornadoes are rated on the Enhanced Fujita scale (Figure 10-9; Figure 10-10) that is used to measure the intensity based on wind speed calculated from the observation of structural damage after the fact. The wind speed calculated used here are not the same as observations from a standard surface station. While all tornadoes can be hazardous, the scale ranges from EF 0 (65-85 mph wind gusts) to EF 5 (> 200 mph gusts).
U.S. Tornado Climatology
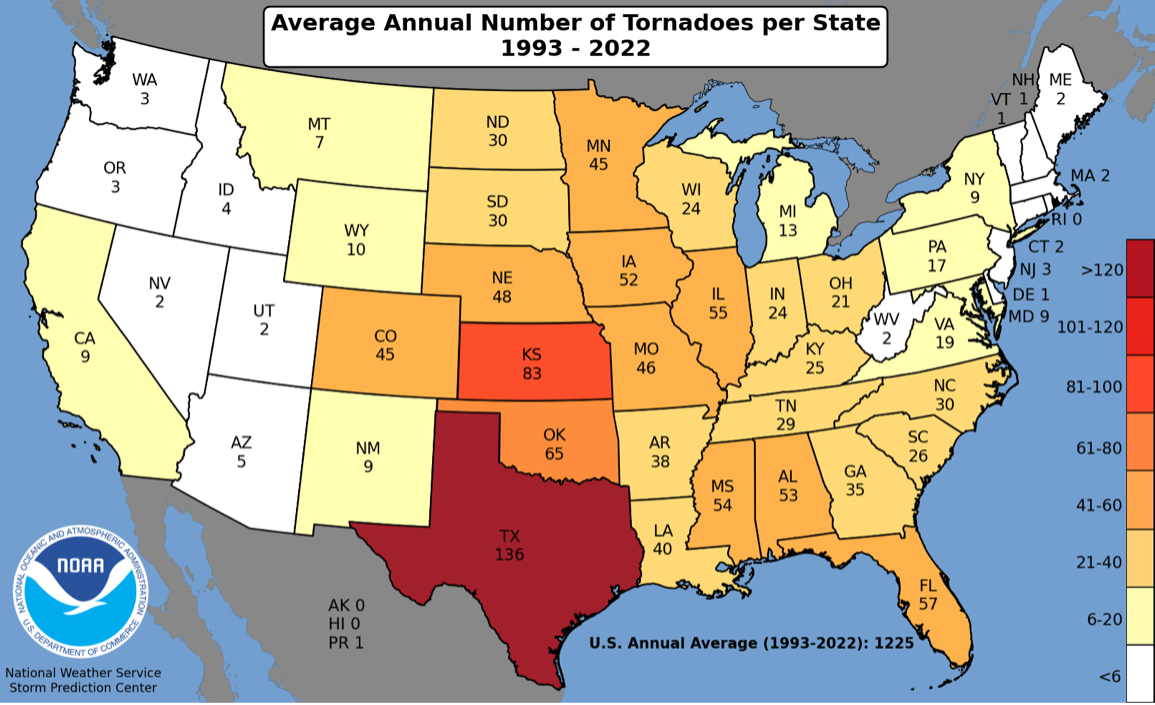
Tornadoes have been observed in the U.S. at all hours of the day and all days of the year. Geographically, however, there are portions of the country that experience a higher frequency of tornadoes than others. Figure 10-11 is the 30-year climatology of tornadoes per state. Tornadoes are most common in the Great Plains and Southeastern U.S., but keep in mind this graphic does not account for the state’s size. For example, Texas is the largest of the contiguous 48, and is shown here as having the highest tornadoes per year. If scaled to a common size, states such as KS, OK, MS, AL, IA, IL, and LA have the highest frequency of tornadoes at > 9 tornadoes per 10,000 sq miles.
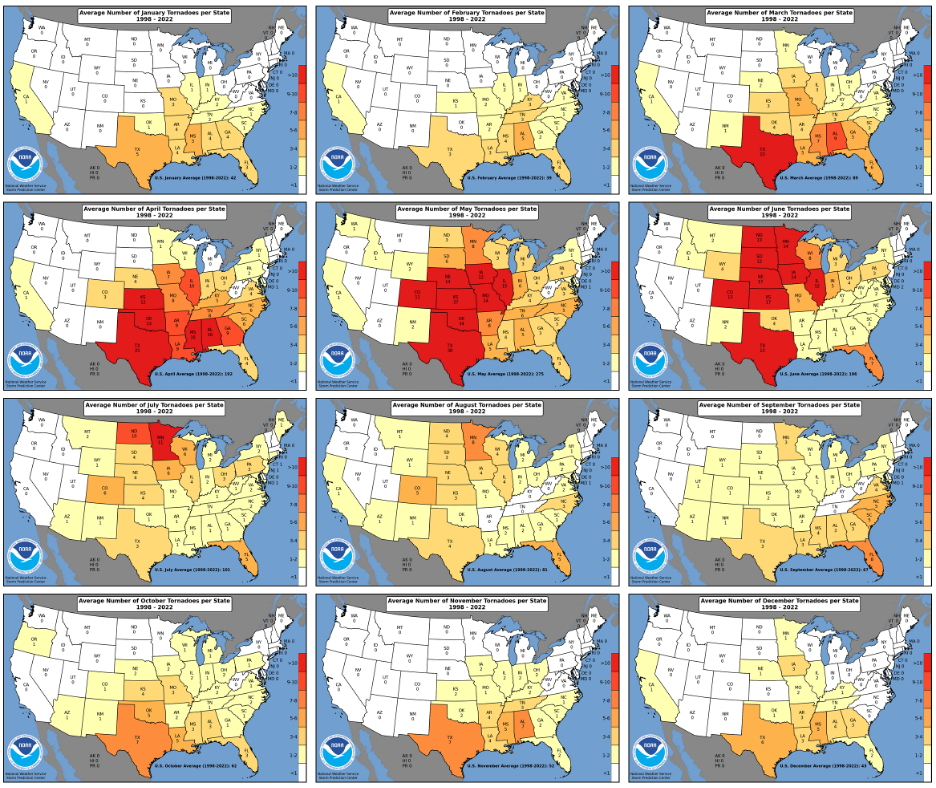
Generally, tornadoes are most frequent in the U.S. from March through July, however during the calendar year certain regions of the U.S. are more prone to experiencing tornadoes than others. Figure 10-12, below, is a 12-panel plot showing the average annual number of tornadoes per state for each month of the year, with January in the top left and December in the bottom right. Note how there is a latitudinal shift in areas with higher tornado frequency as we move from early spring to mid-summer and back. You can access the full chart (with a higher resolution) at: https://www.spc.noaa.gov/wcm/permonth_by_state/
For additional climatological information about U.S. tornadoes (and other severe weather), the Storm Prediction Center’s page is a wealth of information: https://www.spc.noaa.gov/wcm/
Concept Check
Based on the 25-year climatology from 1998-2022, what month out of the year does Kentucky have the highest frequency of tornadoes?