4 Lab #4: Humidity, Condensation, and Clouds
Lab #4
Zachary J. Suriano
Introduction and Objectives
Atmospheric water vapor is a critical variable that influences not only the ability for clouds and precipitation to form, but also human comfort and disease transmission. In lab #1, we introduced water vapor as a variable gas, where depending on time of year and location, it could be as high as 4%, or as low as 0%, of the atmosphere by volume. In this lab, we will explore the ways in which we can represent the amount of water vapor in the air, how it influences people, and how it can change phase to yield things such as dew, fog, and clouds.
Specific learning objectives of this lab are to:
- Calculate the wet bulb depression.
- Interpret graphics and tables of humidity metrics.
- Determine the heat index based on observations of air temperature and humidity.
- Differentiate the different types of fog.
- Identify clouds based on their characteristics.
Humidity
As we will/have discussed in class, there are many different ways we can represent the amount of water vapor in the air. The term humidity is a generic way of referring to this amount of water vapor. More specifically, we can specify the humidity by (a) specific humidity: evaluating the mass of water vapor to the mass of the air, (b) absolute humidity: evaluating the mass of water vapor to the volume of air, (c) mixing ratio: evaluating the mass of water vapor to the mass of dry air (i.e., air without the water vapor), and (d) vapor pressure: the partial pressure exerted by water vapor within the air (see Lab #1 for reminder about partial pressures).
While (a), (b), (c), and (d) can be somewhat difficult to measure, they are often used in the context of saturation to determine the arguably most common metric of humidity: relative humidity. An air parcel reaches saturation when it that has reached its capacity with respect to water vapor, where the number of water molecules evaporating into the air is the same as the number condensing back out. When an air parcel reaches saturation, it is said to not be able to “hold” any more water vapor, based on its temperature. So, the vapor pressure (or mixing ratio, etc.) represents the actual amount of water vapor in the air parcel, while the saturation vapor pressure (or saturation mixing ratio, etc.) represents the amount of water vapor that could be in the air parcel for a given temperature. The ratio of actual water vapor to potential water vapor based on the temperature is the relative humidity.
RH = ( [ Actual Water Vapor Content ] / [ Potential Water Vapor ] ) x 100 (to represent as a %)
A value of 80% would indicate the air has 80% of the water vapor it could have if it was saturated. This is not a reflection of how much water vapor is actually there, but rather a measure of how close the air is to saturation.
Wet and Dry Bulb Temperatures
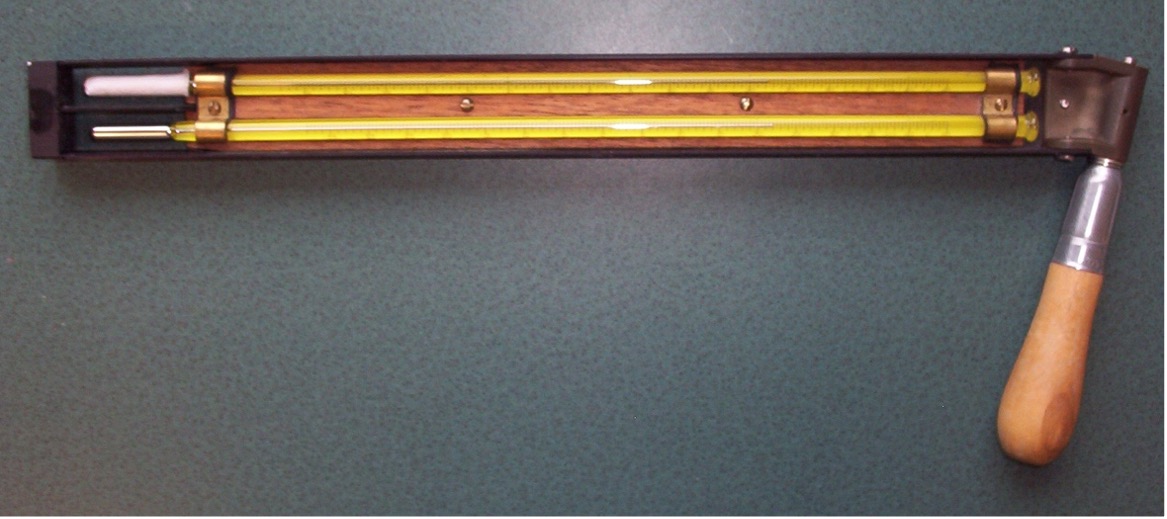
Because (a) – (d) can be difficult to measure, we typically rely on psychrometric charts to determine relative humidity using the dry and wet bulb temperatures. Dry and wet bulb temperatures are determined from an instrument called a sling psychrometer. One is shown below (Figure 4-1).

It works by having two thermometers mounted next to each other on a swiveled mount. One thermometer is left as is (dry), while the other thermometer however has a small piece of cloth attached that is first soaked in water (wet). Using the handle, the two thermometers are twirled for around 60-90 seconds. The dry thermometer is used to measure the dry bulb temperature, while the wet thermometer measures the wet bulb temperature. The lab TAs have a number of sling psychrometers you can use to see how this works. Alternatively, there are many videos online that show how the instrument works. Here is a very brief one: https://www.youtube.com/watch?v=mB9VTmQ5V4o
With the dry and wet bulb temperatures in hand, we can use a psychrometric chart to determine the relative humidity. At the end of this document, you will find a series of charts that plot relative humidity. You’ll notice these have two terms, the Dry Bulb temperature and the wet bulb depression (not the wet bulb temperature itself!). To calculate the wet bulb depression, you simply take the difference between the dry bulb temperature and the wet bulb depression.
For example, you used a sling psychrometer and found the dry bulb temperature was 55°F, and the wet bulb temperature was 48°F. To find the wet-bulb depression, we take the difference of dry and wet bulbs:
Wet Bulb Depression = ( Dry Bulb Temperature ) – ( Wet Bulb Temperature )
Wet Bulb Depression = ( 55°F ) – ( 48°F )
Wet Bulb Depression = ( 7°F )
Concept Check #1
Take a minute to practice calculating the wet bulb depression from the following observations.
| Dry Bulb Temperature | Wet Bulb Temperature | Wet Bulb Depression |
| – 15.0 °C | -17.5 °C | |
| 12.8 °C | 3.2 °C | |
| 89.1 °F | 79.9 °F |
Looking back at your answers, what did you notice? Note how the wet bulb depression is always a positive number. That is because the dry bulb temperature will always be equal to or greater than the wet bulb temperature.
With the wet bulb depression in hand, we can now determine the relative humidity based on the charts. An example is below using the same information as before (Figure 4-2). The dry bulb is 55°F and the wet bulb depression is 7°F. Using the chart, we find the row with a dry bulb temperature of 55°F, and then the column with a depression of 7°F.

At this intersection, we find the relative humidity is 59%. In this case, our values were perfectly in-line with the table values, making it easy to determine the exact value. But sometimes, the values on the dry bulb or wet bulb depression axes will be different.
For instance in a second example, if the dry bulb was 51°F and the wet bulb depression was 7°F, we would identify the relative humidity as more than the 55% identified from the 50°F dry bulb row, but less than the 59% relative humidity identified from the 55°F dry bulb row. Because 51°F is closer to 50°F than 55°F, we interpolate the value between the two and would end up with an answer ~ 56% relative humidity.
Concept Check #2
Use the following information to determine the relative humidity. Round your relative humidity value to the nearest whole number. Consult the psychrometer charts at the end of this file. Don’t forget about first calculating the wet bulb depression (keep 1 decimal place for the depression value).
| Dry Bulb Temperature | Wet Bulb Temperature | Relative Humidity |
| 5.0 °F | -1.0 °F | |
| 12.8 °F | 3.2 °C | |
| 89.1 °F | 79.9 °F |
Dew Point Temperature
Another means of evaluating humidity is the dew point temperature. This is the temperature the air parcel must be cooled to reach saturation (without adding any new water vapor). What makes the dew point advantageous, compared to relative humidity, is that changing the air temperature does not change the dew point temperature; only changes in water vapor change the dew point. Similar to relative humidity, we can use (different) psychrometric charts to find the dew point temperature from the dry and wet bulb temperatures. You will find these charts also at the end of this file.
Heat Index
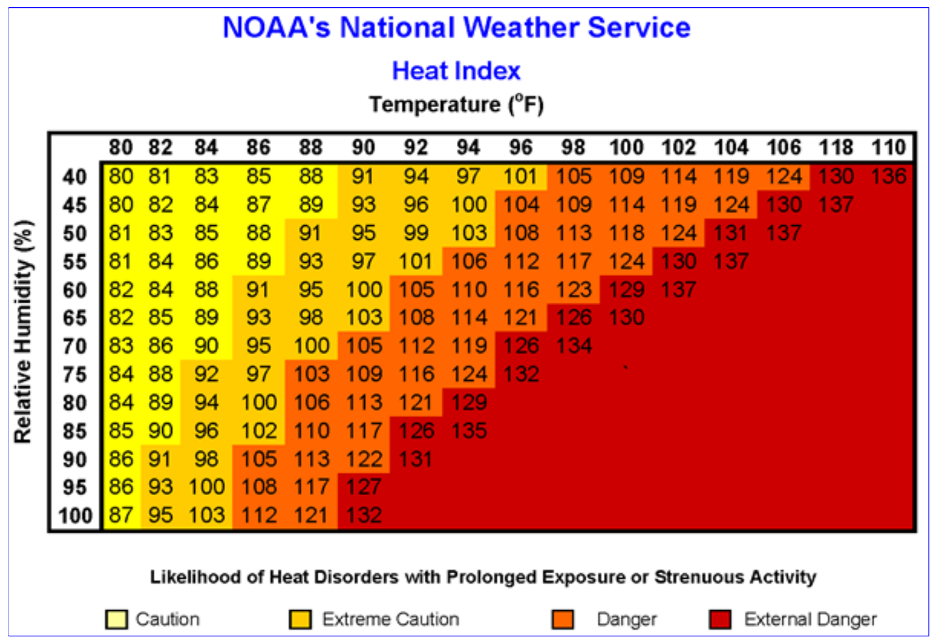
Just as in the previous lab there were meteorological indices that incorporated human comfort, e.g., wind chill, we can similarly consider the role of humidity in influencing how (un)comfortable certain temperatures feel to people. Enter: the Heat Index. This is an apparent temperature index that indicates how a certain combination of air temperature and relative humidity would feel. Increased levels of relative humidity make it more difficult for water vapor to evaporate from our skin. When there is less evaporation going on, we do not get the cooling benefit of that phase change, and in turn we feel warmer. Similar to determining relative humidity from dry and wet bulbs, we can use a table to quickly determine the heat index from the relative humidity and the air temperature. There are also color-coded heat index values that indicate the relative risk of heat disorders.

Concept Check #3
Determine the Heat Index for the following conditions.
| Temperature | Relative Humidity | Heat Index |
| 80°F | 65% | |
| 96°F | 40% | |
| 96°F | 65% | |
| 104°F | 50% |
Fog
Fog is a cloud that forms in contact with the surface, and is said to have formed when the visibility is less than 1.0 km. Just as with other clouds, they form by the air becoming saturated and water vapor condensing onto condensation nuclei. Fog types are named based on how saturation occurs, through (a) cooling the air to the dew point, (b) adding water vapor though evaporation, or (c) mixing air parcels together. Some of the basic types of fog as briefly described below. You can also learn more about the different types of fog from the PDF linked with this Lab Module that includes photographs.
Radiation Fog: produced by the radiative cooling of the surface. As the surface emits longwave radiation, it cools. The air in contact with that now cooled surface cools as well, resulting in the air parcel’s temperature approaching (and in this case reaching) its dewpoint temperature. Radiation Fog is most common on clear nights with calm winds and a shallow layer of moisture near the surface.
Advection Fog: produced by the moving (or advection) of warm and moist air over a cold surface. Upon contact with the cold surface, the warm air will cool and equal its dewpoint, leading to condensation and fog. Advection Fog is common in the Western US coast, where the relatively warm waters of the Pacific Ocean encounter the coastal waters that are cold due to upwelling.
Upslope Fog: produced by the lifting of moist air due to topography. As the air moves upslope, its temperature decreases and reaching its dew point, resulting in condensation and fog. This type of fog is common in many mountainous areas across North America and globally, including in eastern Kentucky.
Evaporation (or Mixing) Fog: produced by the addition of water vapor to the air via evaporation. This may happen as cold air moves over warm water and the dew point is increased. When this occurs over a body of water, such as a lake, this is coined steam fog. Evaporation Fog may also happen as two unsaturated air parcels/masses mix, as can happen along frontal boundaries (frontal fog).
Concept Check #4
Which type of fog forms on clear, calm nights especially in low-lying areas?
(a) Advection fog
(b) Evaporation fog
(c) Radiation fog
(d) Upslope fog
Clouds
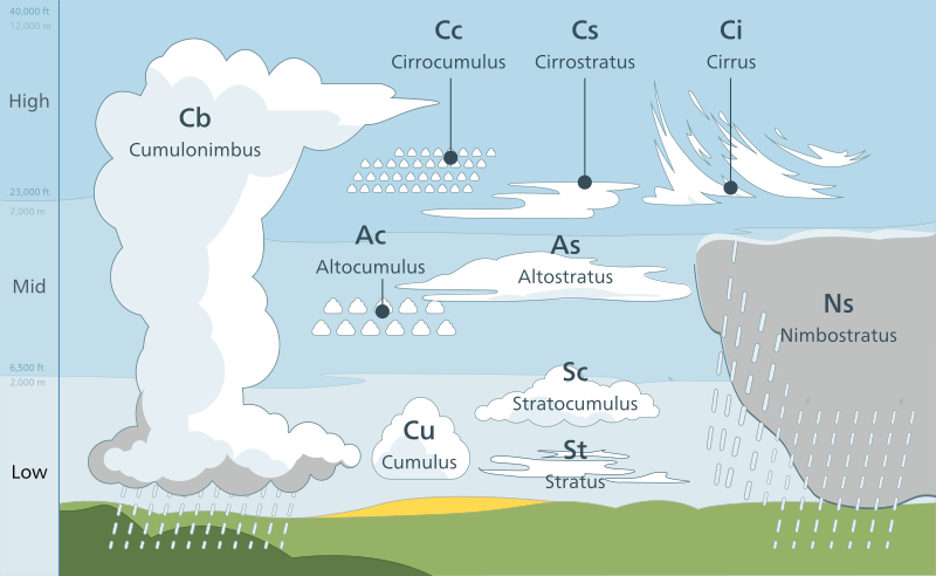
Just as there are different types of fog at the surface, there are different types of clouds at different layers of the atmosphere. Clouds are named based on their height from the surface (high clouds, middle clouds, and low clouds) and their visual characteristics (Figure 4-4). Some additional types of clouds being categorized not by height but by unique other features. The heights provided on the supplementary documentation (link in the lab module page) are based on middle-latitudes. Typically, cloud heights are lower (i.e., closer to the surface) in the polar regions and higher (i.e., further from the surface) in the tropical regions.

Concept Check #5
What type of cloud appears like a thin sheet with an elevation of approximately 4000m (~13,000ft)?
(a) Altocirrus
(b) Nimbostratus
(c) Cumulus
(d) Altostratus