11 Lab #11: Hurricanes
Lab #11
Zachary J. Suriano
Introduction and Objectives
This final lab of the semester will focus on This lab will focus on some of the climatological and safety dimensions of these features, while also complimenting some of the more theoretical and formation-based topics emphasized in lecture. In addition to the information contained within the lab, there is a wealth of information available from other sources, including NOAA and the NWS. The “Preparedness Guide” linked below is worth reviewing from a safety perspective: https://www.weather.gov/media/owlie/ttl6-10.pdf
Specific learning objectives of this lab are to:
- Differentiate a tropical storm, tropical depression, tropical cyclone, and hurricane.
- Describe the Saffir-Simpson scale and its uses.
- Identify regions of the world most vulnerable to tropical cyclones.
- Describe when and where hurricanes typically impact the United States.
Tropical Cyclones
Depending on their strength and location across the world, we have different names for the systems that form over tropical waters with closed circulation. The general term for all of these systems is a tropical cyclone. In the western Pacific these systems are called typhoons. In India they are called very severe cyclonic storms while in Australia, they are called tropical cyclones. In the eastern Pacific and North Atlantic, these systems are known as hurricanes. A Hurricane (or tropical cyclone in the general terminology) is an intense cyclonic storm with sustained winds of at least 64 kts (74 mph) that forms over tropical waters. There formation is closely related to the availability of sensible and latent heat from the warm ocean, low wind shear, atmospheric instability, and surface convergence. Further, sufficient Coriolis force is necessary. A hurricane will go through a distinct set of life cycle stages that typically last for a week or two, but in extreme cases can exist much longer, such as Tropical Cyclone Freddy in 2023 that formed on February 5th and did not dissipate until 37 days later on March 14th.
Life Cycle
(a) Tropical Disturbance: the birth of a hurricane occurs as an easterly wave that leads to small amounts of convergence at the surface. This convergence enhances uplift and cloud formation, resulting in a cluster of thunderstorms known as a tropical disturbance (Figure 11-1).
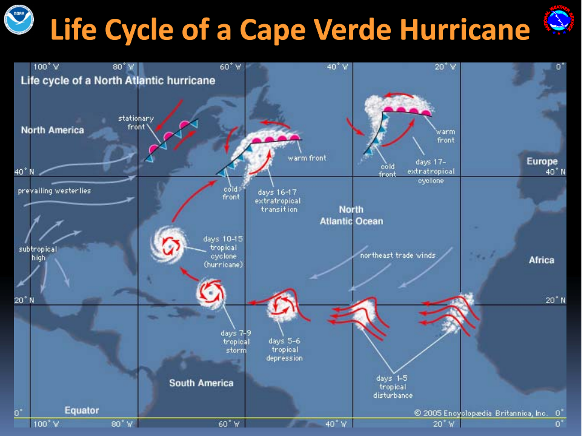
(b) Tropical Depression: if the tropical disturbance grows more intense, a central area of low pressure will form at the surface that causes additional convergence and uplift to further intensify the system. If winds increases to between 20-34 kts (23-39 mph) with a central closed low, the system is classified as a tropical depression.
(c) Tropical Storm: while not all systems continue to develop to this stage, with sufficient oceanic and atmospheric conditions, the central low will strengthen and further increase winds speeds. When the wind speeds exceed 34 kts (39 mph) the system is considered to be a tropical storm. Storms receive names at this stage to aid in communication with the public. The names are predetermined for the year on a 6-year cycle. Names are only removed if the storm was so costly or deadly that its future use is deemed to be insensitive. Name lists are available: https://www.nhc.noaa.gov/aboutnames.shtml Names starting with the letters Q, U, X, Y, and Z are excluded from the lists.
(d) Hurricane: if the tropical storm intensifies further such that the sustained wind speed exceeds 64 kts (74 mph), the system is classified as a hurricane. As we will see further in lab, the Saffir-Simpson scale is used to further classify hurricanes based on their wind speed into categories 1 through 5.
(e) Post-tropical cycle: if a tropical cyclone moves into higher latitudes, it will begin to lose its tropical characteristics and take-on those of a mid-latitude cyclone. This extratropical transition usually entails weakening of the winds, but as seen with Hurricane Sandy that made second landfall in 2012 as a extratropical storm, the impacts can still be substantial.
Concept Check:
What is the name for a tropical system with a central closed low and sustained wind speeds of 30-35 mph?
(a) Air mass thunderstorm
(b) Tropical depression
(c) Tropical storm
(d) Hurricane
Saffir-Simpson Scale
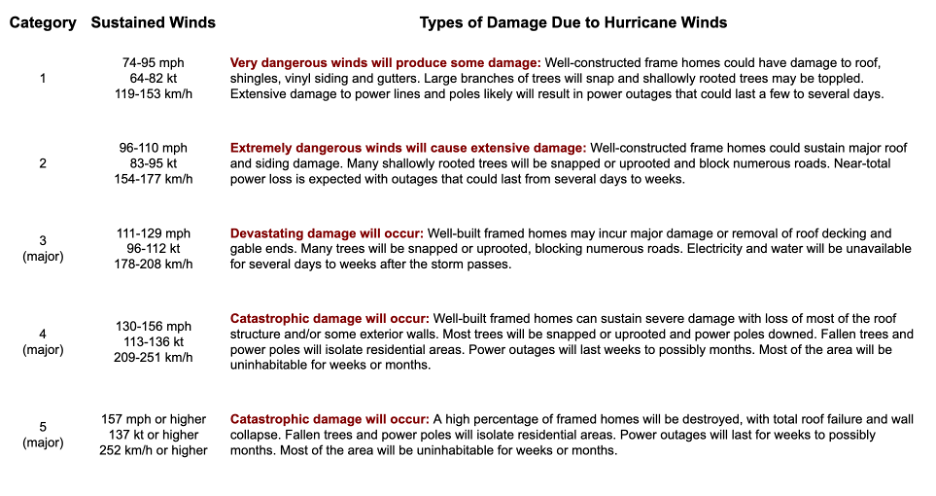
Hurricanes are rated on a scale from 1 to 5 based on the maximum sustained wind speed. A category 1 has the (relatively) weakest wind speeds while a category 5 has a strongest winds. The scale does not take any other potentially deadly hazards, such as storm surge, rainfall, or tornadoes into account.
Concept Check:
Major hurricanes are defined as being:
(a) Category 1-5
(b) Category 3-5
(c) Category 5 only
Tropical Cyclone Climatology
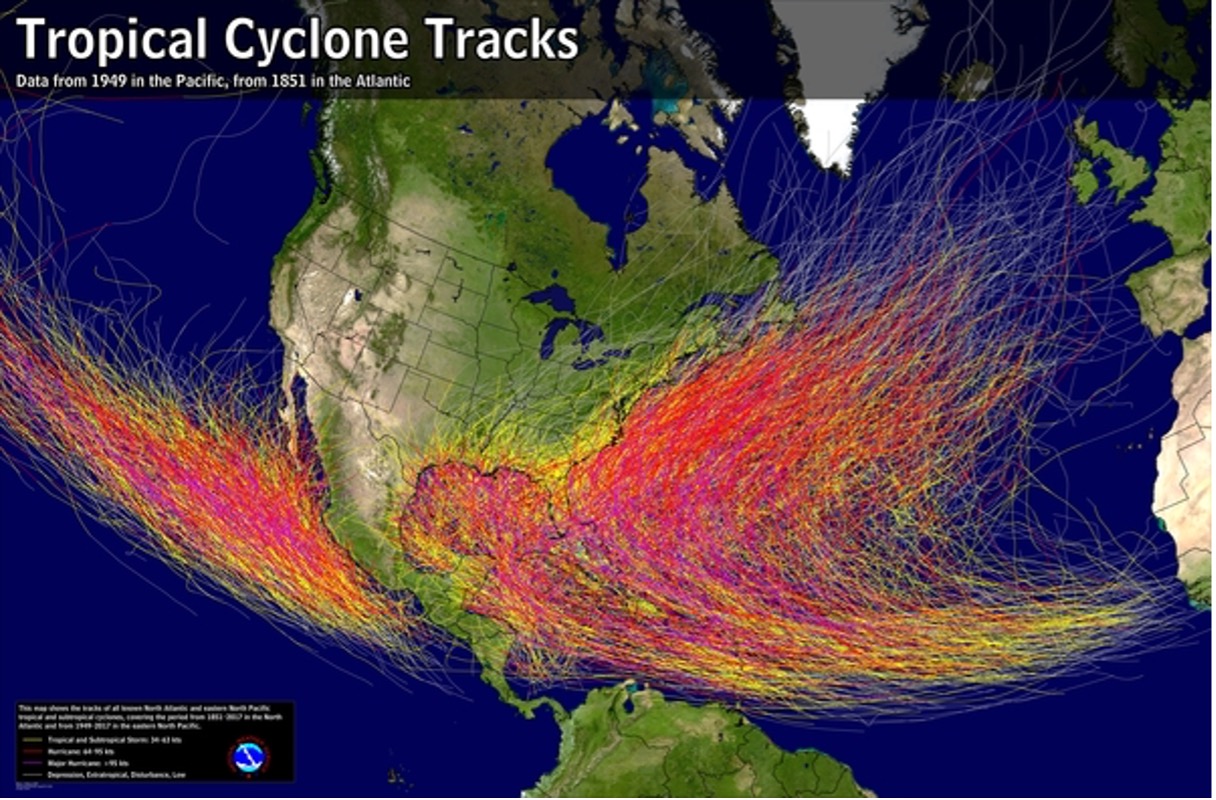
Tropical cyclones typically form between 5-30° latitude in both hemispheres, where there are sufficiently warm oceanic waters. In those latitude bands, the systems typically move from east to west, sometimes with a northerly component (i.e., SE to NW; Figure 11-3). Once they reach approximately 30° latitude, the storms will take on a SW to NE direction.
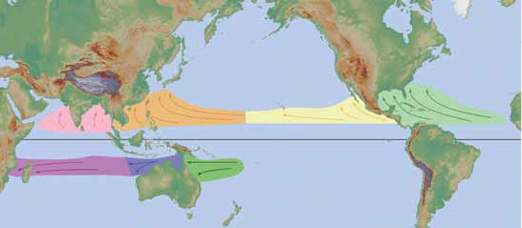
Tropical cyclones do not form directly at or adjacent to the equator due to the lack of Coriolis force. Recall from earlier in the semester that the Coriolis force at the equator is zero, thus can impart no spin (or deflection) to the wind. Tropical cyclones in the South Atlantic is exceptionally rare due to limited tropical disturbances and strong vertical wind shear. Conversely, they are rare in the south-east Pacific due to relatively cold sea-surface temperatures.
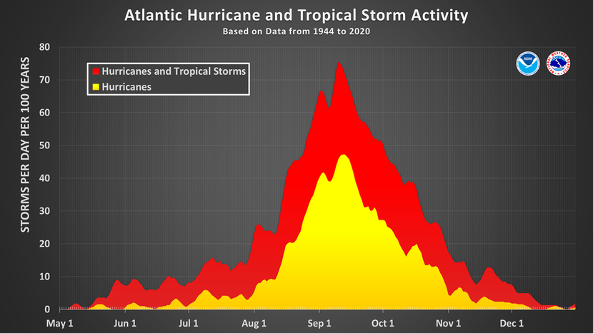
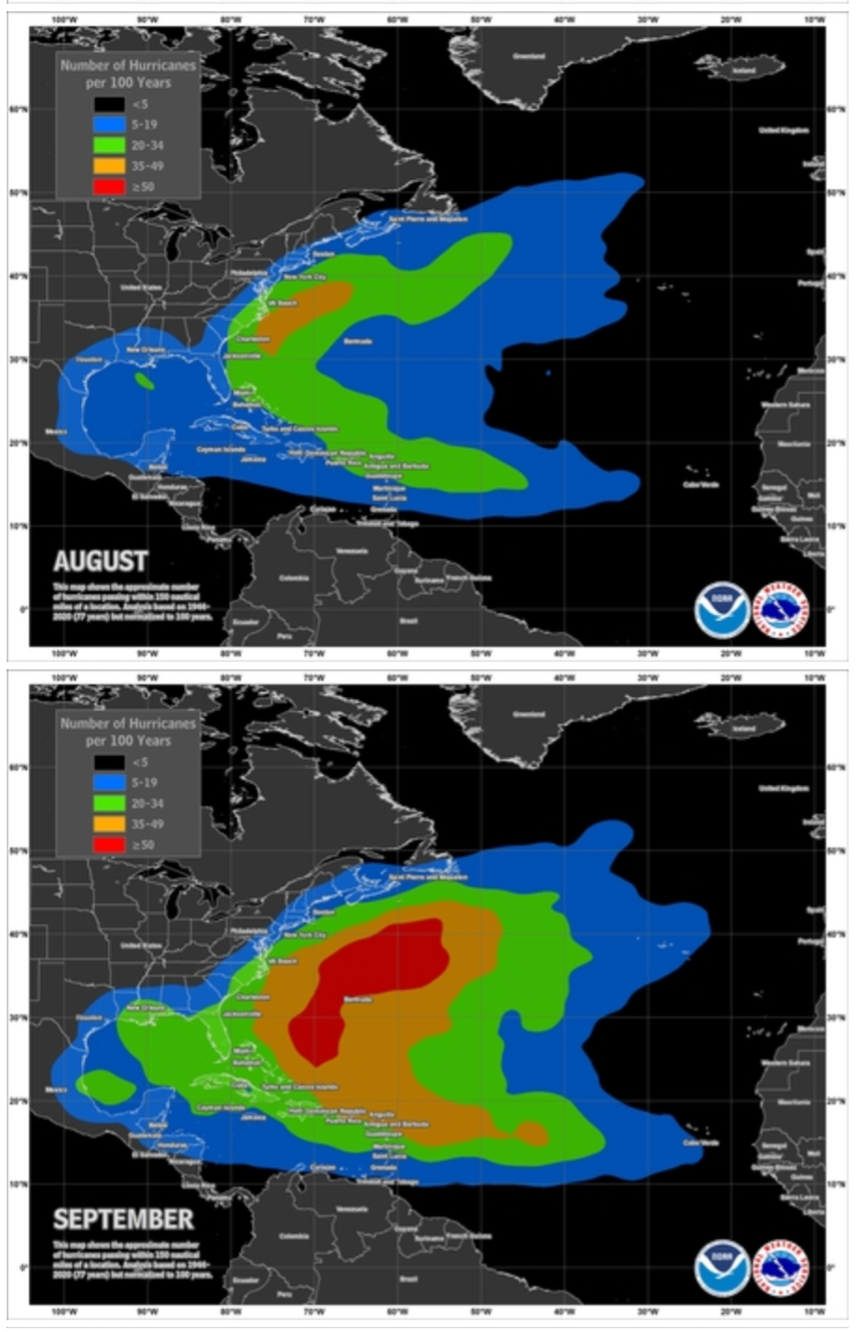
Within the calendar year, hurricanes and tropical storms are regularly observed from mid-May through December. In the Atlantic, they are most prominent from August through October (Figure 11-4).
During the year, there are different zones of preferred hurricane occurrence in the northern Atlantic (Figure 11-5). In June/July (not shown) Hurricanes are not overly common, but if they form, they are most common (5-20%) in the northwestern portions of the Gulf of Mexico and along the Carolina’s coast towards Bermuda. By August, there is substantially higher frequency and most storms take a “C” shaped path from the Caribbeans towards mainland U.S., and then east back out to sea towards northern Europe. This “C” shape is perhaps best seen from a composite map of all hurricanes and tropical cyclones relative to the U.S. (Figure 11-6). Where there is clearly a preference for formation in the central Atlantic, with movement towards North America, and an eventual “curl” to the east or northeast.
A more complete climatology of not just Atlantic, but also eastern and central Pacific hurricanes is available at: https://www.nhc.noaa.gov/climo/
Concept Check
True/False. Hurricanes regularly develop along the Equator due to the presence of warm sea-surface temperatures.
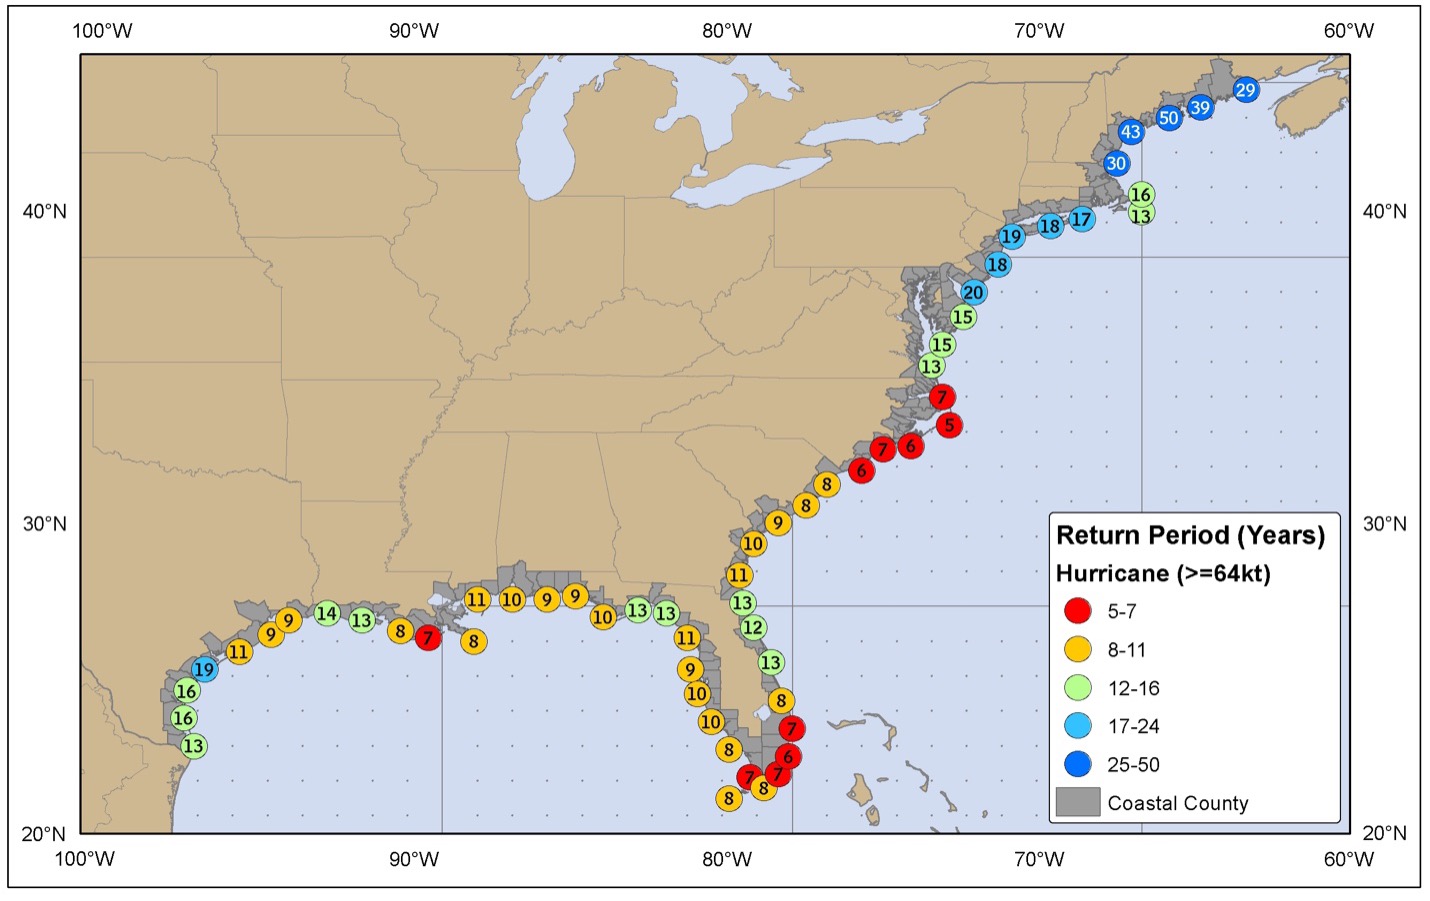
Hurricanes (and tropical cyclones in general) pose a serious hazard to coastal communities, and as such, statistics not just of occurrence are tracked, but also frequency of landfall (i.e., when a hurricane makes direct contact with the land). The map above was derived based on hurricane frequency, with the color-coded coastal values indicating how often a hurricane makes landfall at that location in a 50-year period. Dark blue tones show areas where hurricane landfall is rare, less often than once every 25 years. These locations are relatively sheltered from the typical “C” shaped storm track hurricanes take in the Atlantic basin, thus are less common. In contrast, areas in red have the highest frequency, corresponding to landfall once every 5 to 7 years. These regions include extreme southern Florida, coastal North Carolina, and southern Louisiana. As with any return interval statistic, a location might have a return interval of once every 9 years, but could still experience back-to-back years with a landfall.
Concept Check
What is the return interval for a hurricane making landfall in coastal Alabama?